The Illusion of Wealth & How to Beat Inflation: A 100-Year Perspective
The Illusion of Wealth, How to Beat Inflation: A 100-year research study tracking dollar dilution and asset class returns since 1926.
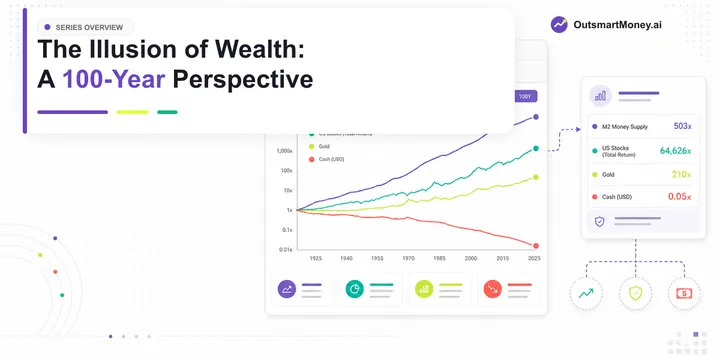
Gold price multiple since the 1928 baseline.
Purchasing power relative to the money supply (less than 1.0 means loss).
Nominal price growth following the end of the gold standard.
5 articles matching this topic.
The Illusion of Wealth, How to Beat Inflation: A 100-year research study tracking dollar dilution and asset class returns since 1926.

Nvidia Stock Prediction, Gold Price Forecast, and Bitcoin projections for 2030 and 2035. An investing playbook to protect purchasing power.

Crypto vs Stocks: How the digital era and Bitcoin compressed wealth timelines compared to traditional equities and S&P 500 compounding since 1971.

Historical Asset Class Returns: The final 100-year scorecard comparing S&P 500, gold, housing, cash, and bonds against M2 money supply expansion.

Gold vs Real Estate, Which Asset Beat Inflation? We compare historical yields and cash returns against M2 money supply growth over a 100-year timeline.
Nominally yes, growing 210.3x since 1928. However, when adjusted for M2 money supply expansion (which grew 473.3x), gold actually lost 55.6% of its purchasing power relative to the total money pool.
Gold performs exceptionally well during periods of high stagflation and structural monetary shifts, such as the 1970s following the abandonment of the gold standard, where it grew 17.6x against M2's 5.3x expansion.