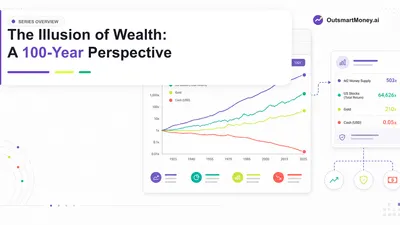
The Illusion of Wealth (Part VI)
Nvidia Stock Prediction & Gold Price Forecast 2030: The Modern Playbook
This is Part VI of the "Illusion of Wealth" series tracking 100 years of dollar value dilution.
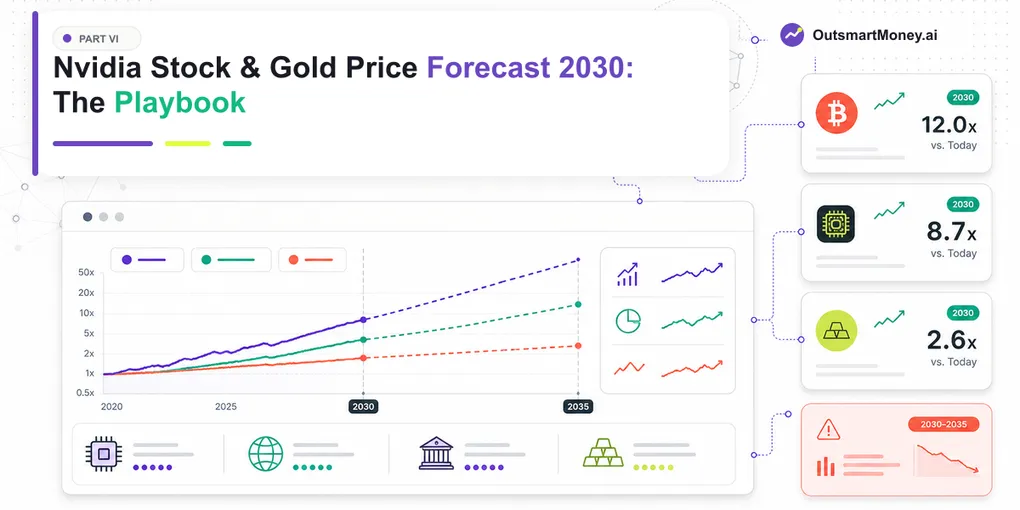
Table of Contents
Over the past five sections, we established a mathematical reality: to preserve purchasing power, an asset’s compound annual growth rate (CAGR) must exceed the expansion rate of the M2 money supply. Historically, this required an absolute minimum yield of 6.56% annually.
For decades, the safest way to achieve this was to hold yield-bearing assets (like real estate or the S&P 500) and relentlessly reinvest the income. A more concentrated, higher-upside approach was the Berkshire Hathaway model, owning a curated basket of cash-flowing businesses that retained and compounded every dollar of profit.
However, the digital revolution fundamentally altered this environment. Technology companies and digital assets achieved in 15 to 30 years what took traditional compounding models 60 years.
This brings us to the ultimate question for an investor today: Looking forward to 2030 and 2035, which assets offer the best probability of beating the printing press, and what are the true risks involved?
The Fundamental Asymmetry: Fixed Supply vs. Infinite Expansion
Before analysing specific price targets, we must understand the core driver of asset prices over the next decade: the ongoing debasement of fiat currency.
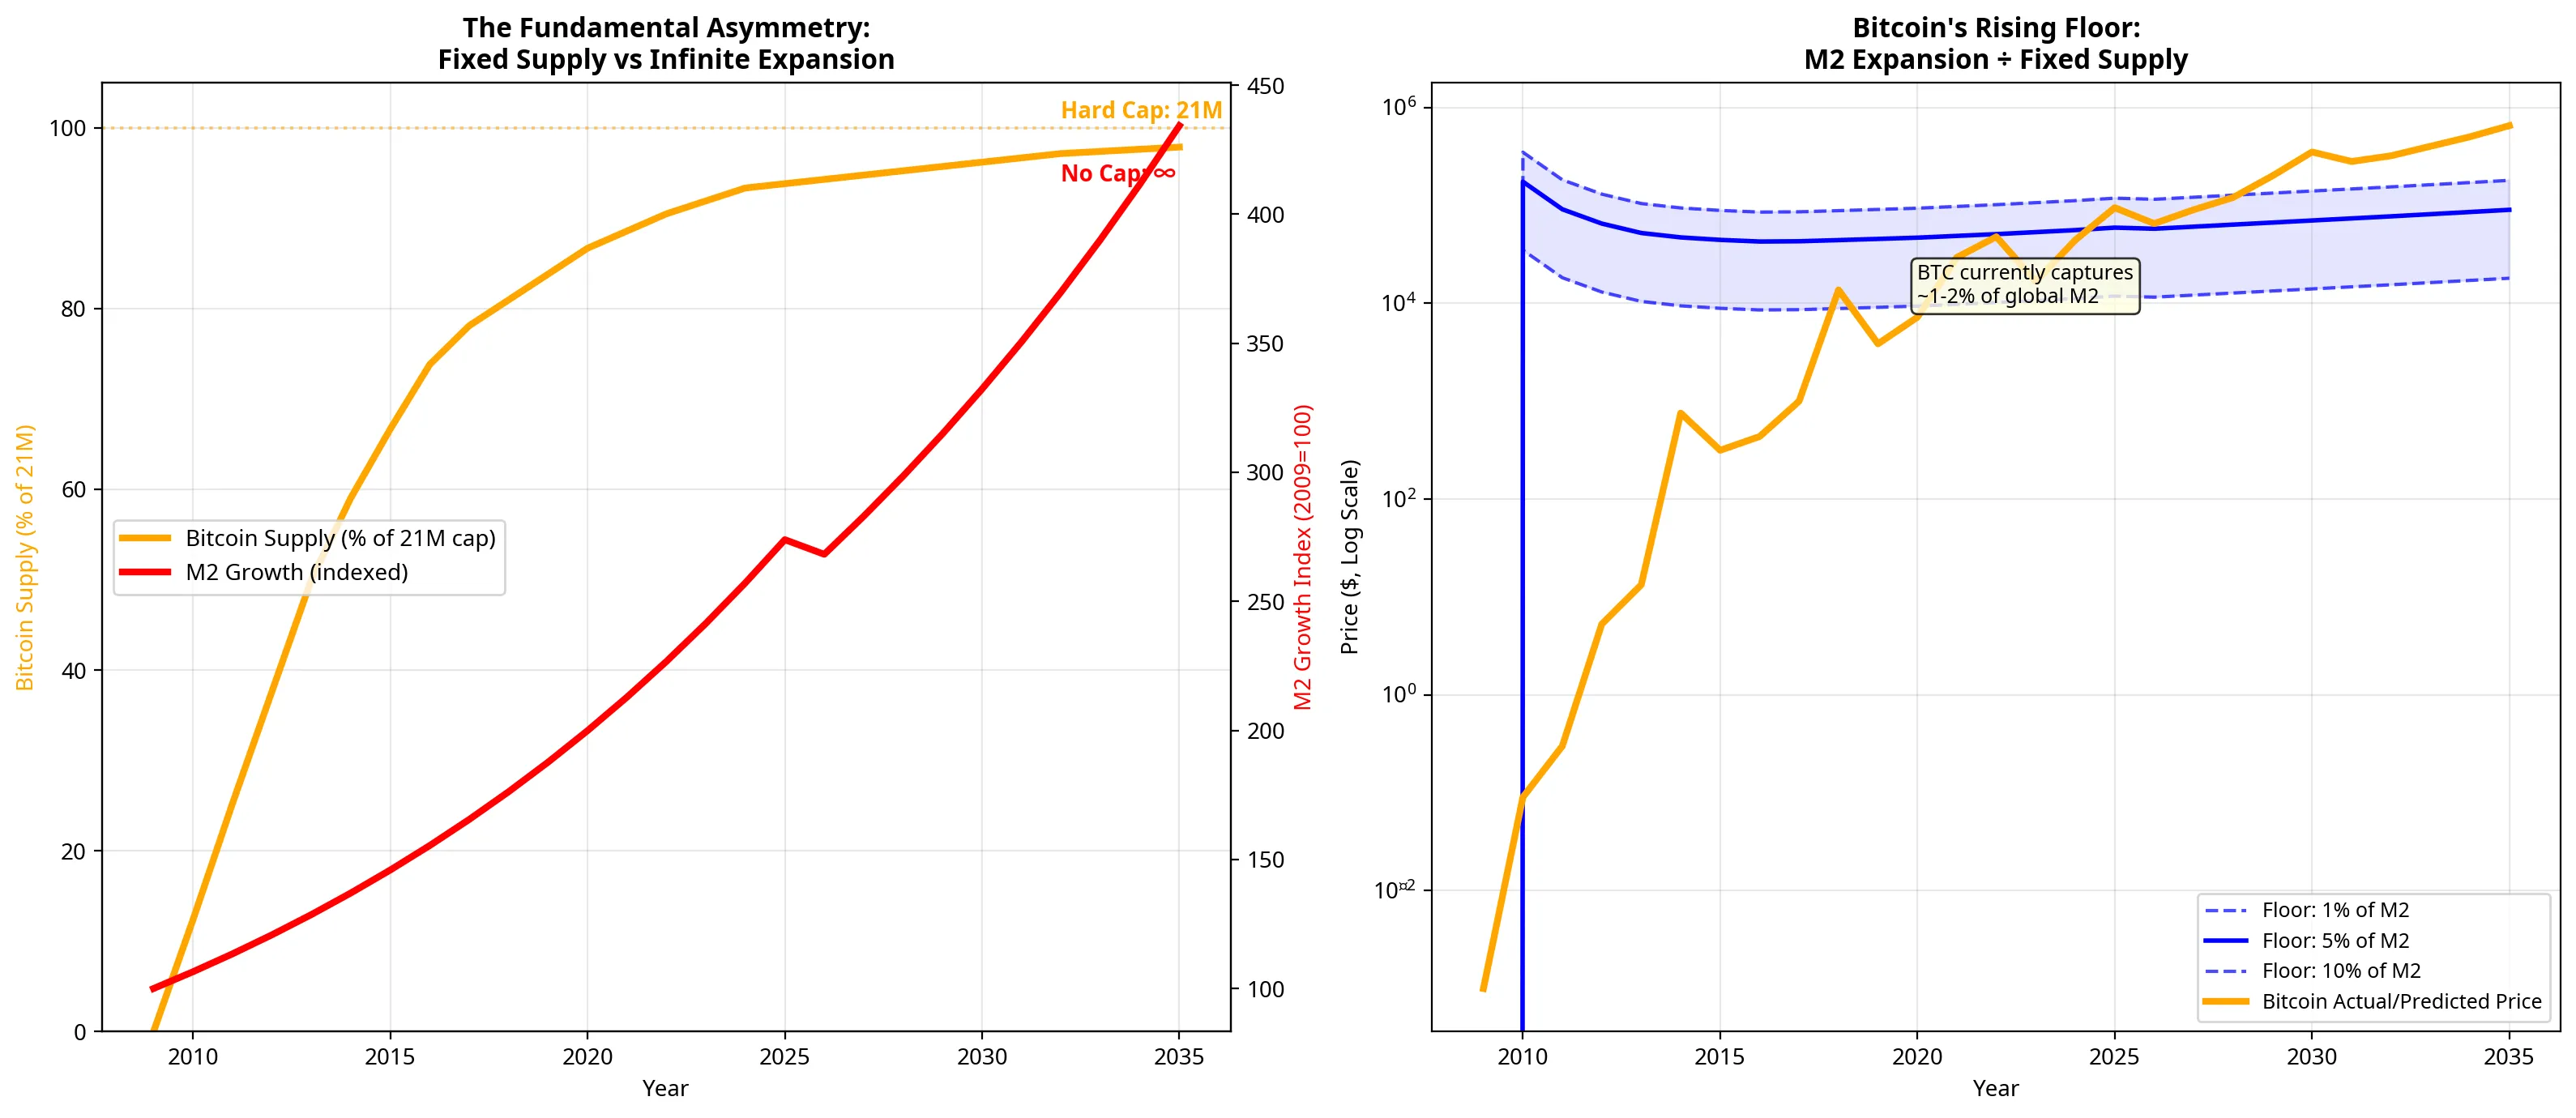
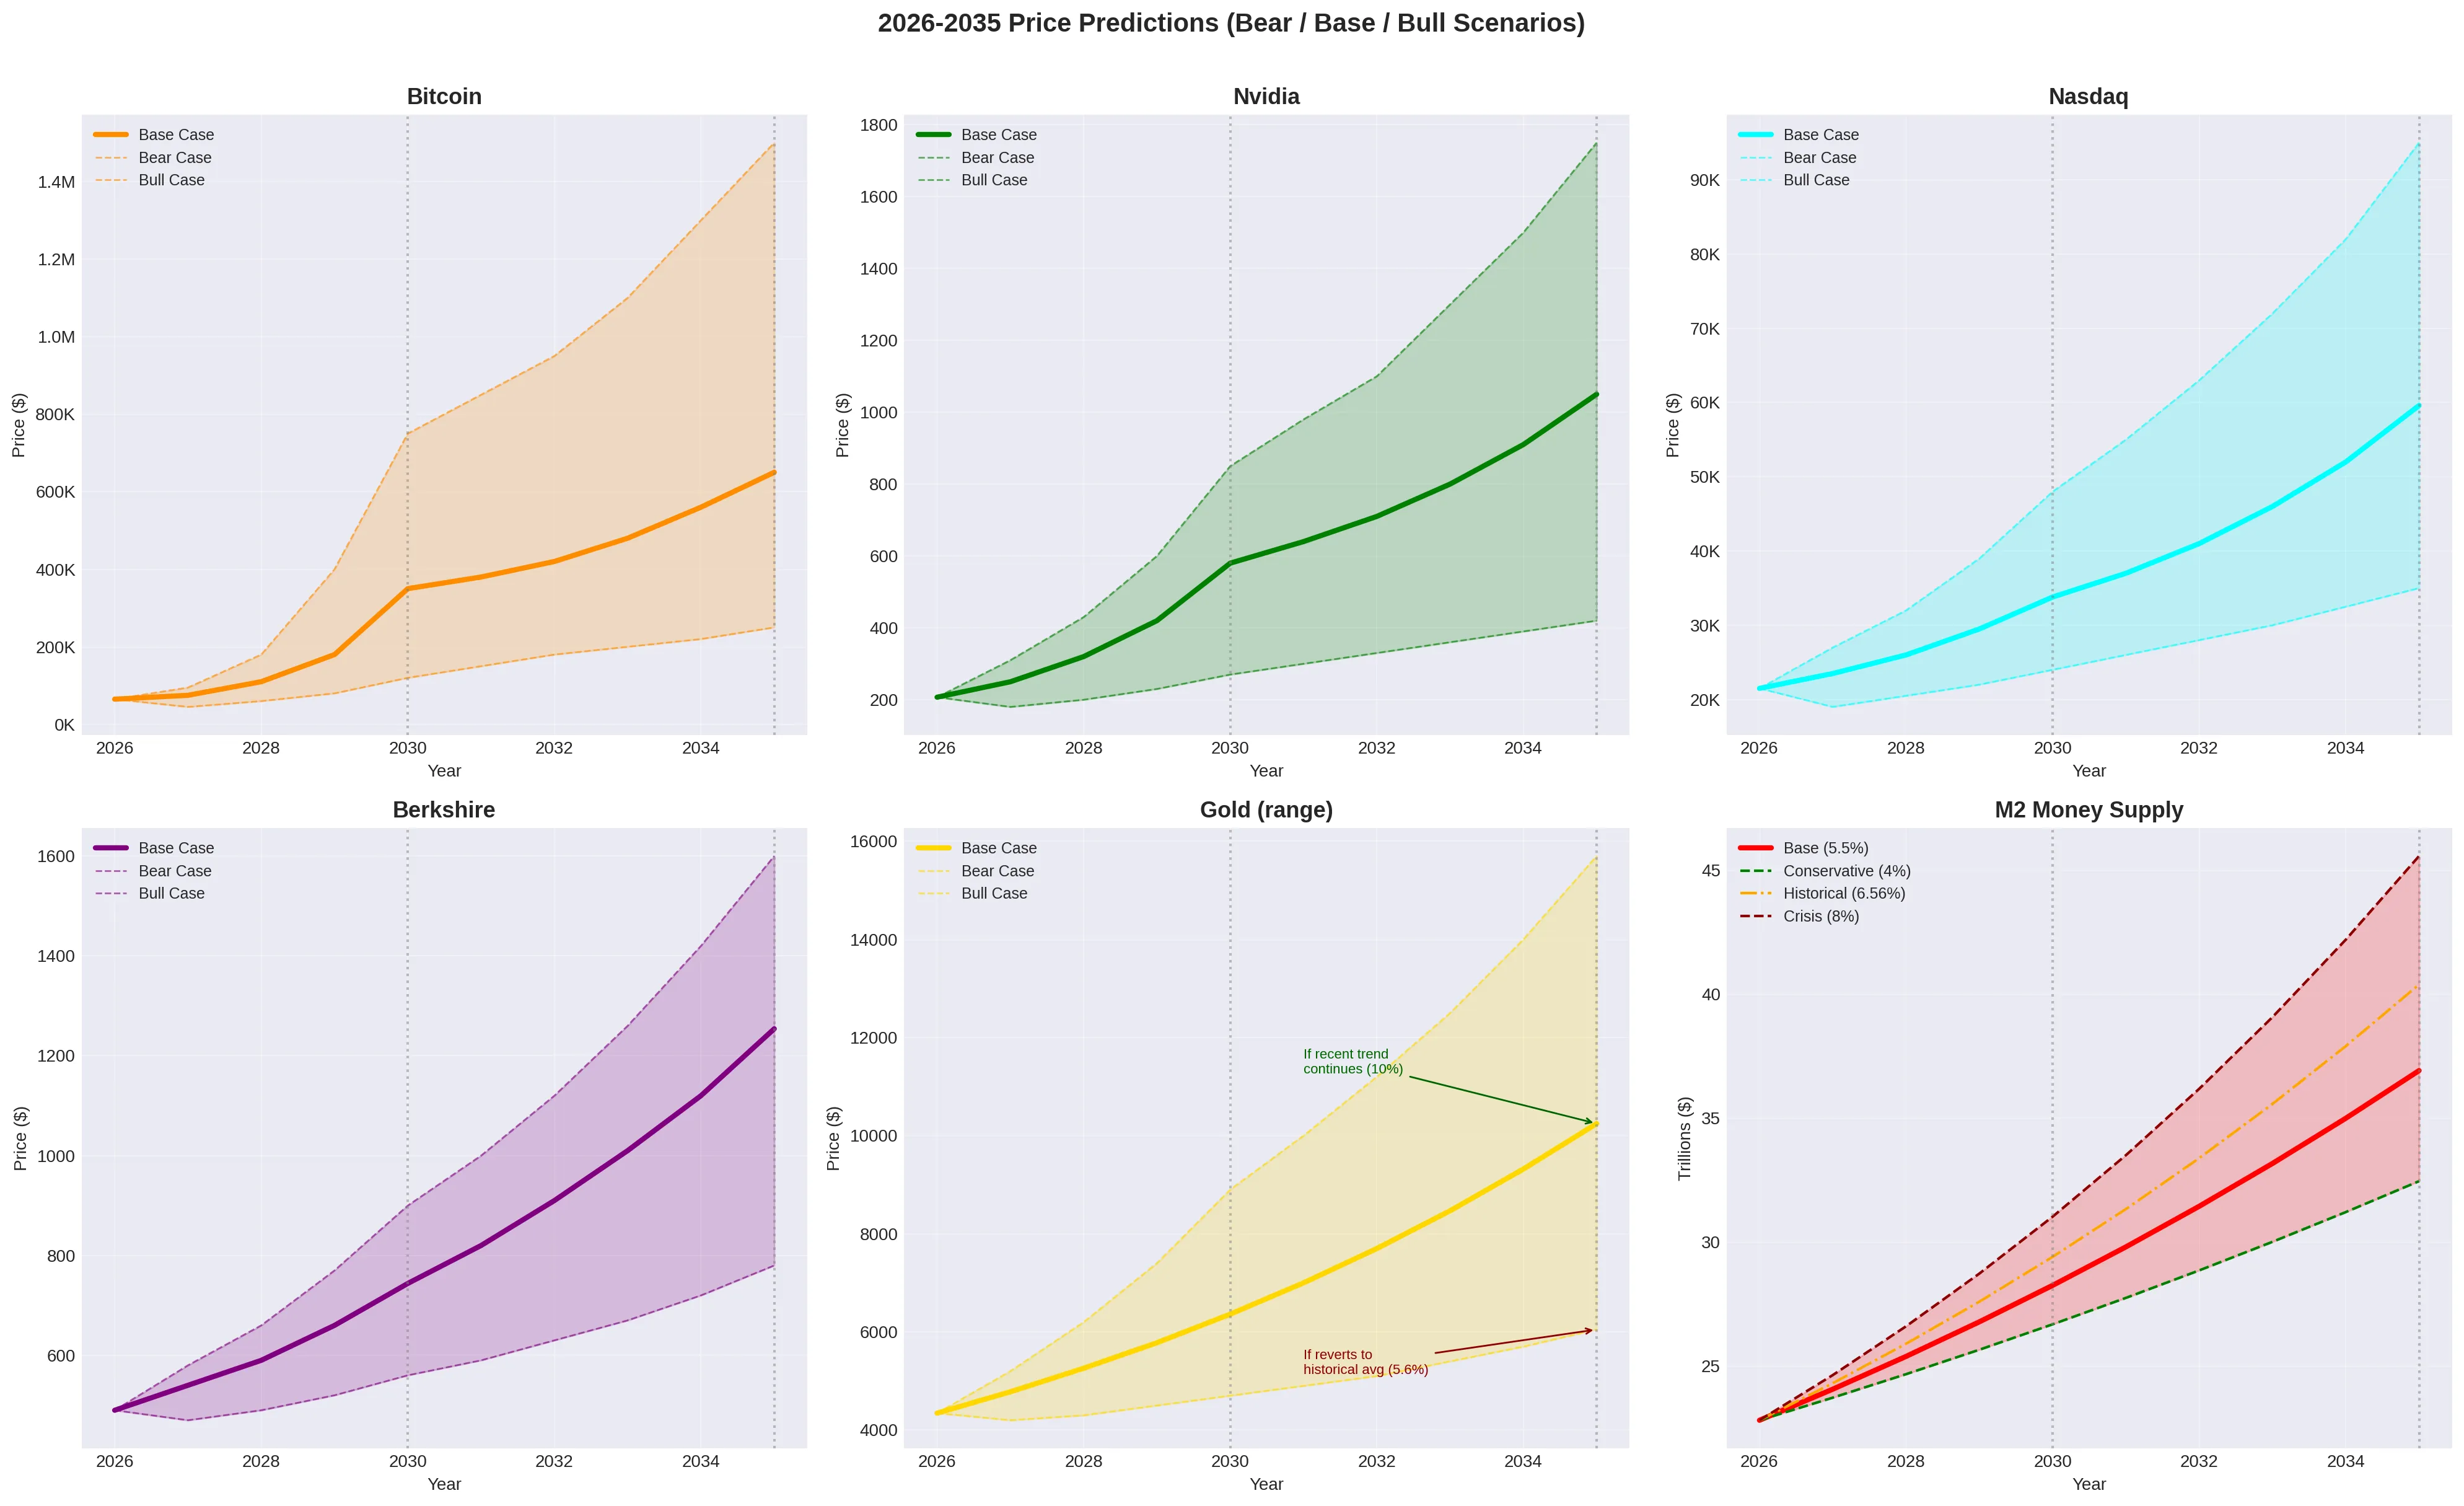
As shown in the chart above, the US M2 money supply currently sits at a record $22.8 trillion [1]. Assuming a conservative base-case growth rate of 5.5% annually, M2 will reach approximately $28.2 trillion by 2030 and nearly $37.0 trillion by 2035.
Bitcoin represents the mathematical opposite of this dynamic. With a hard cap of 21 million coins and an issuance rate that halves every four years, its supply schedule is entirely inelastic. Currently, Bitcoin captures roughly 1% to 2% of global M2. If it merely maintains this percentage share as the fiat denominator expands, its price floor rises structurally every year.
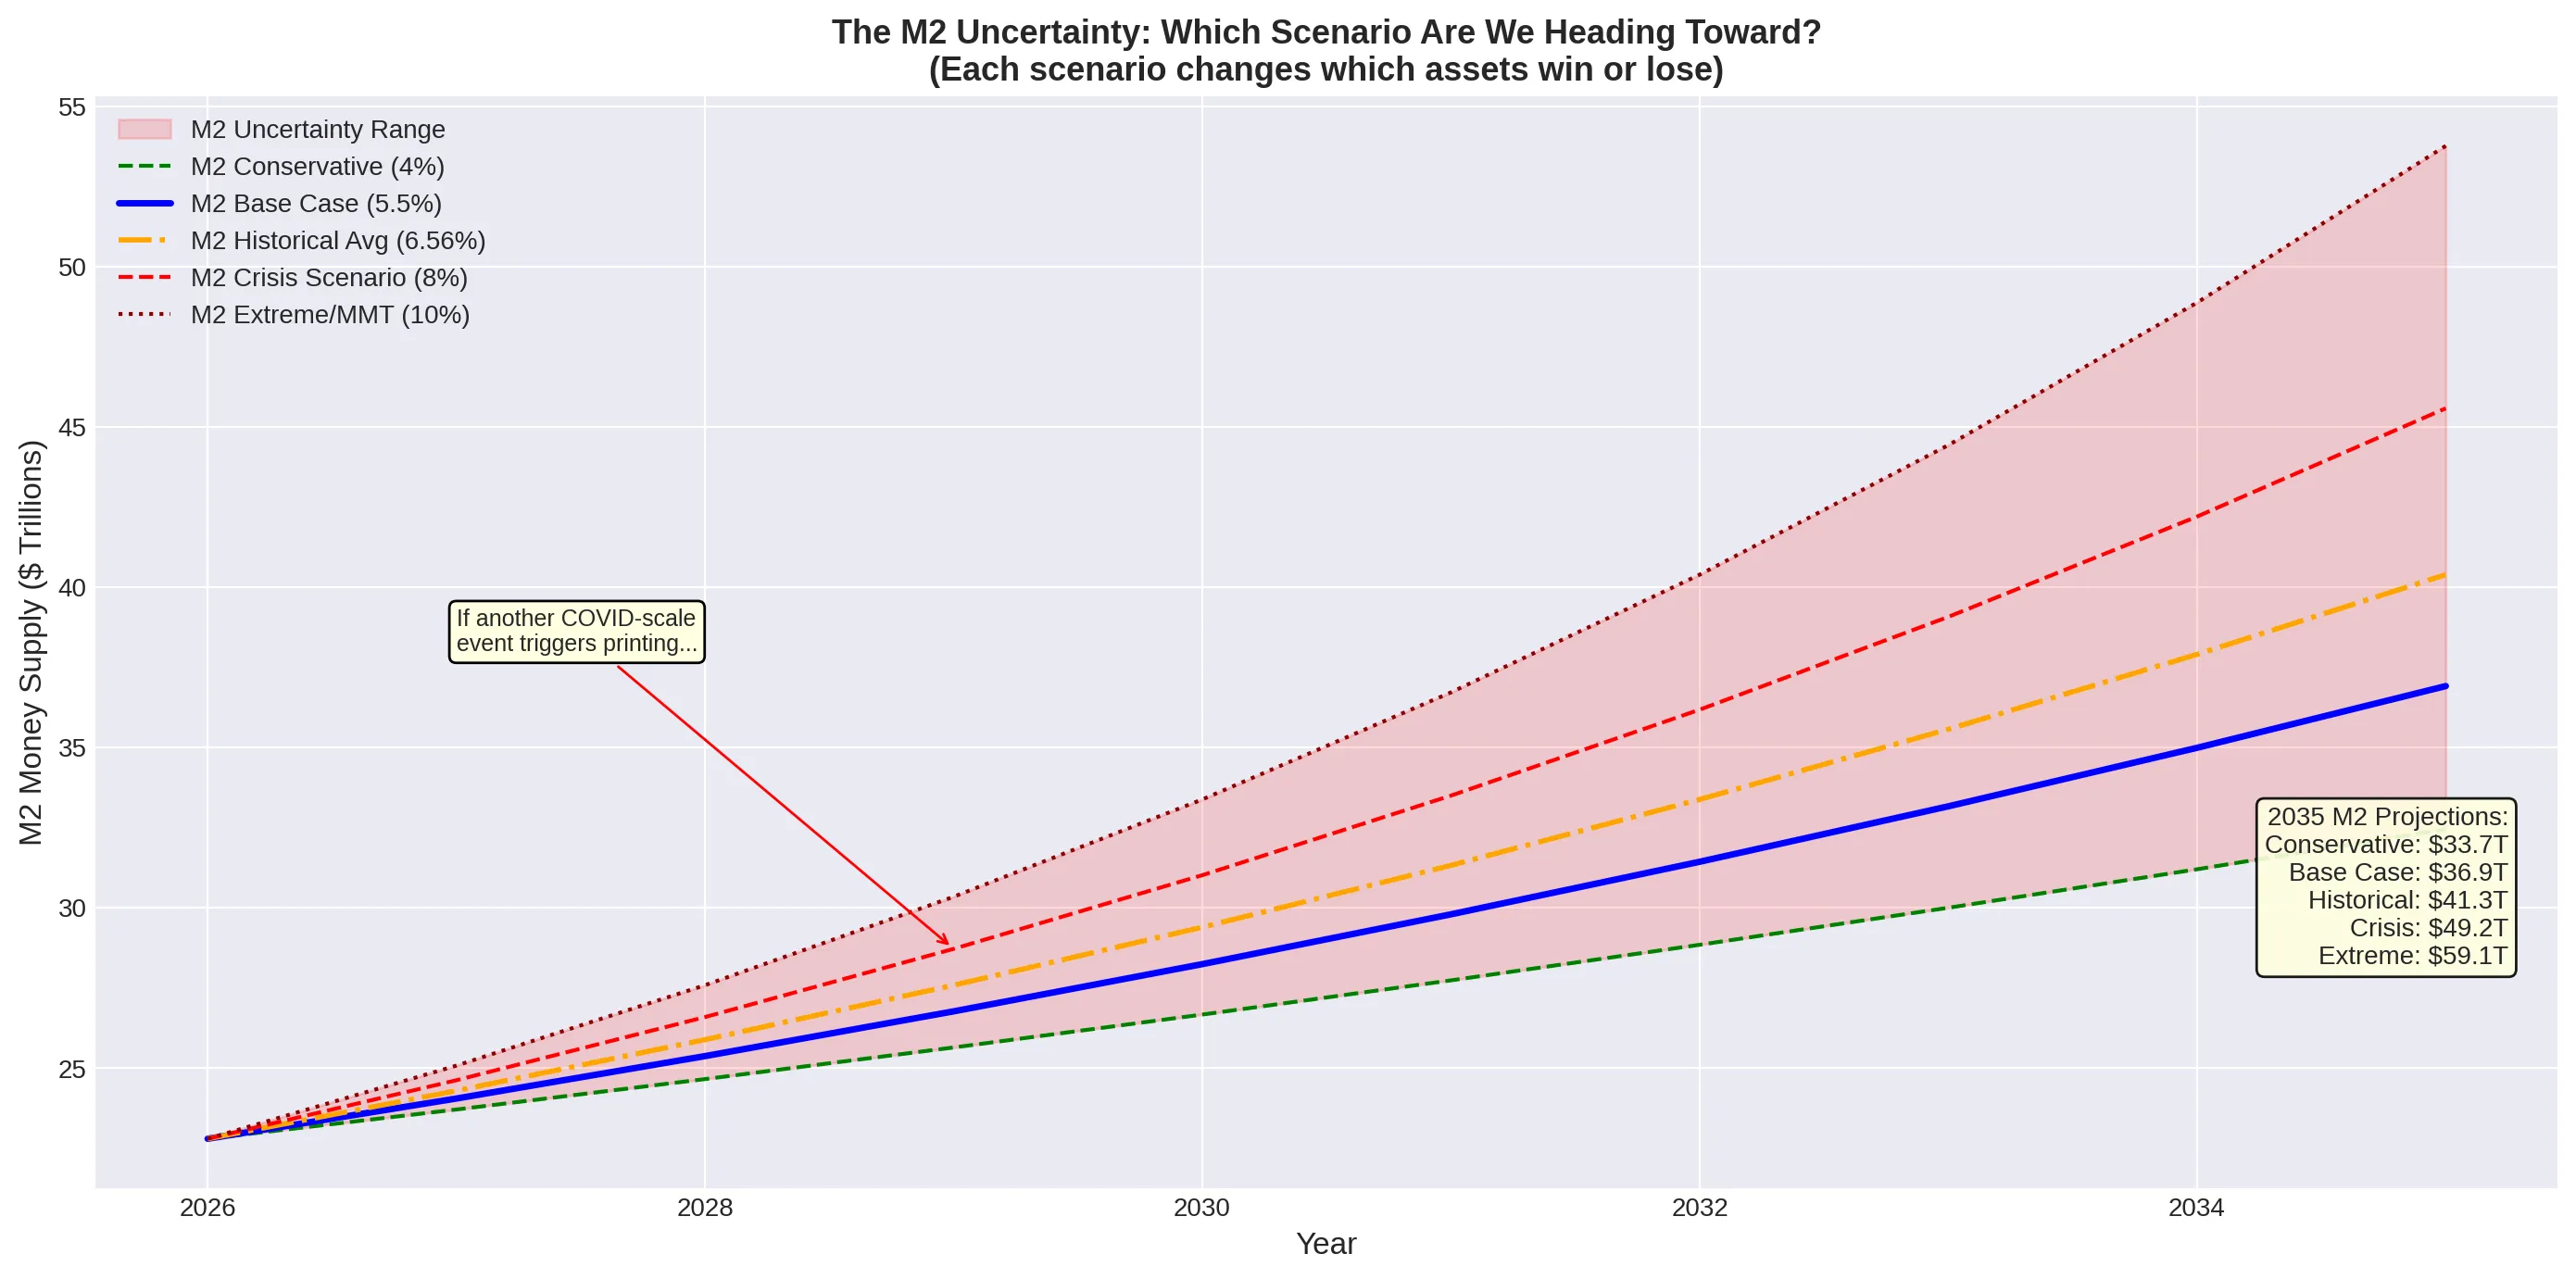
The range of outcomes depends heavily on the pace of monetary expansion. Under a bear case (4% annual M2 growth), the denominator still expands meaningfully. Under a bull case (7%+ growth, driven by recession-era stimulus), the purchasing power of every dollar erodes even faster, making scarce assets proportionally more valuable in nominal terms.
The Bubble Question: Is the AI Boom a Dot-Com Repeat?
When evaluating technology stocks like Nvidia or the broader Nasdaq, the most common objection is that we are experiencing a repeat of the 2000 dot-com bubble.
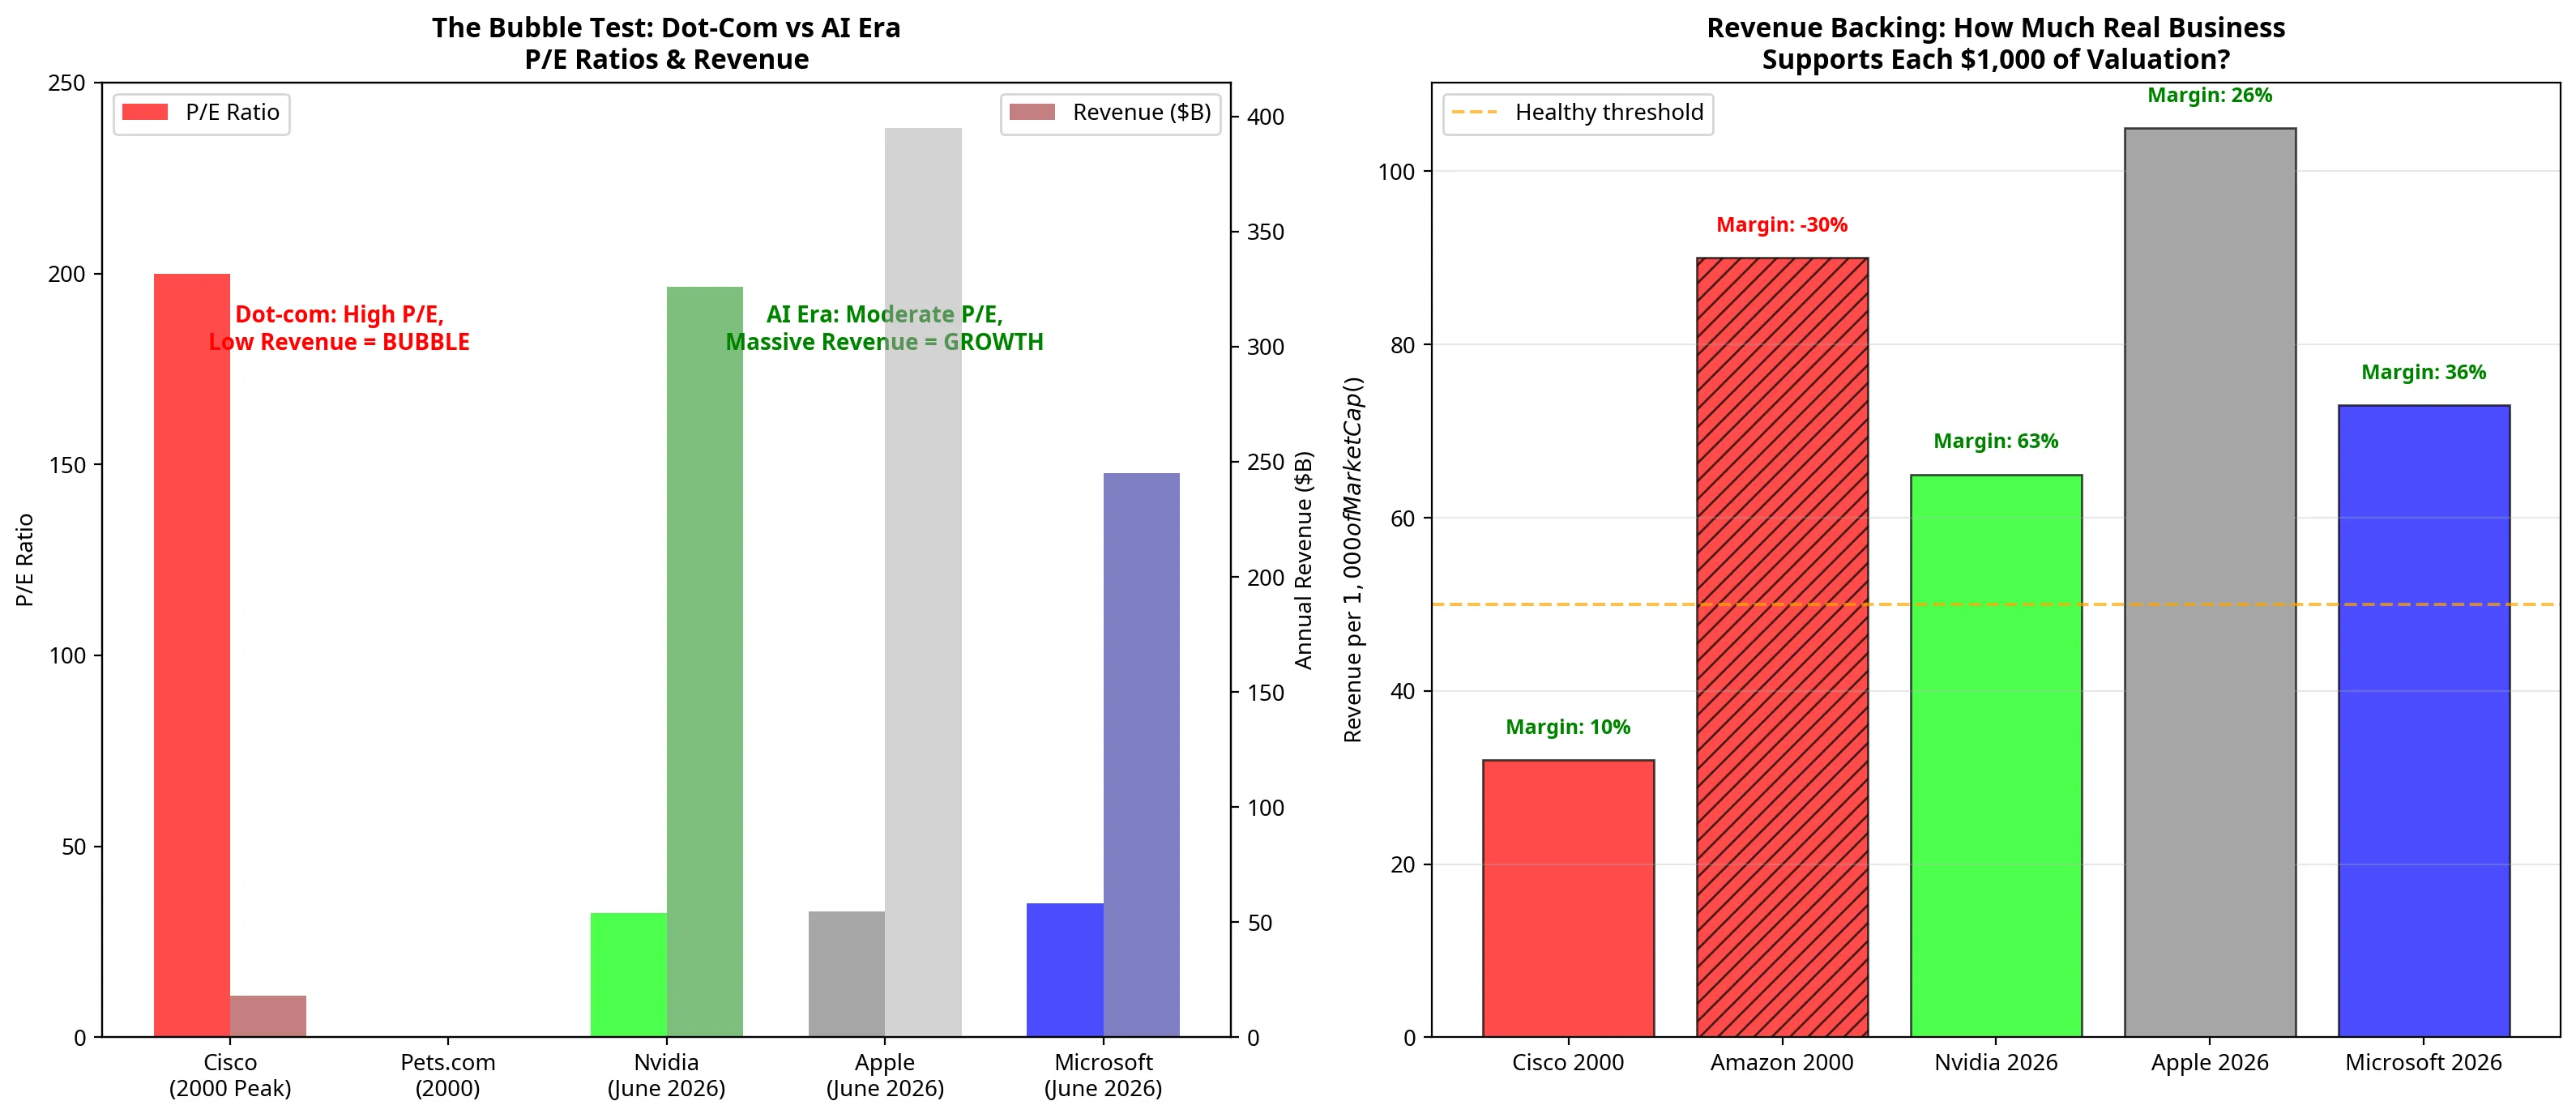
The data strongly refutes this comparison. In 2000, Cisco reached a peak market capitalisation of over $500 billion while generating roughly $18 billion in annual revenue, trading at a price-to-earnings (P/E) ratio near 200. Many dot-com darlings, such as Pets.com, had zero earnings and minimal revenue.
By direct comparison, Nvidia in mid-2026 generates massive, tangible cash flows. With projected FY2027 revenues of approximately $367 billion [2] and net profit margins exceeding 60% [3], Nvidia is trading at a forward P/E in the mid-20s. Its growth rate will inevitably decelerate (a mathematical certainty when dealing with hundreds of billions in revenue), but a slowing growth rate is not the same as a bubble bursting.
Diminishing Returns: The Maths of Large Numbers
A critical concept for both Nvidia and Bitcoin is the law of diminishing percentage returns.
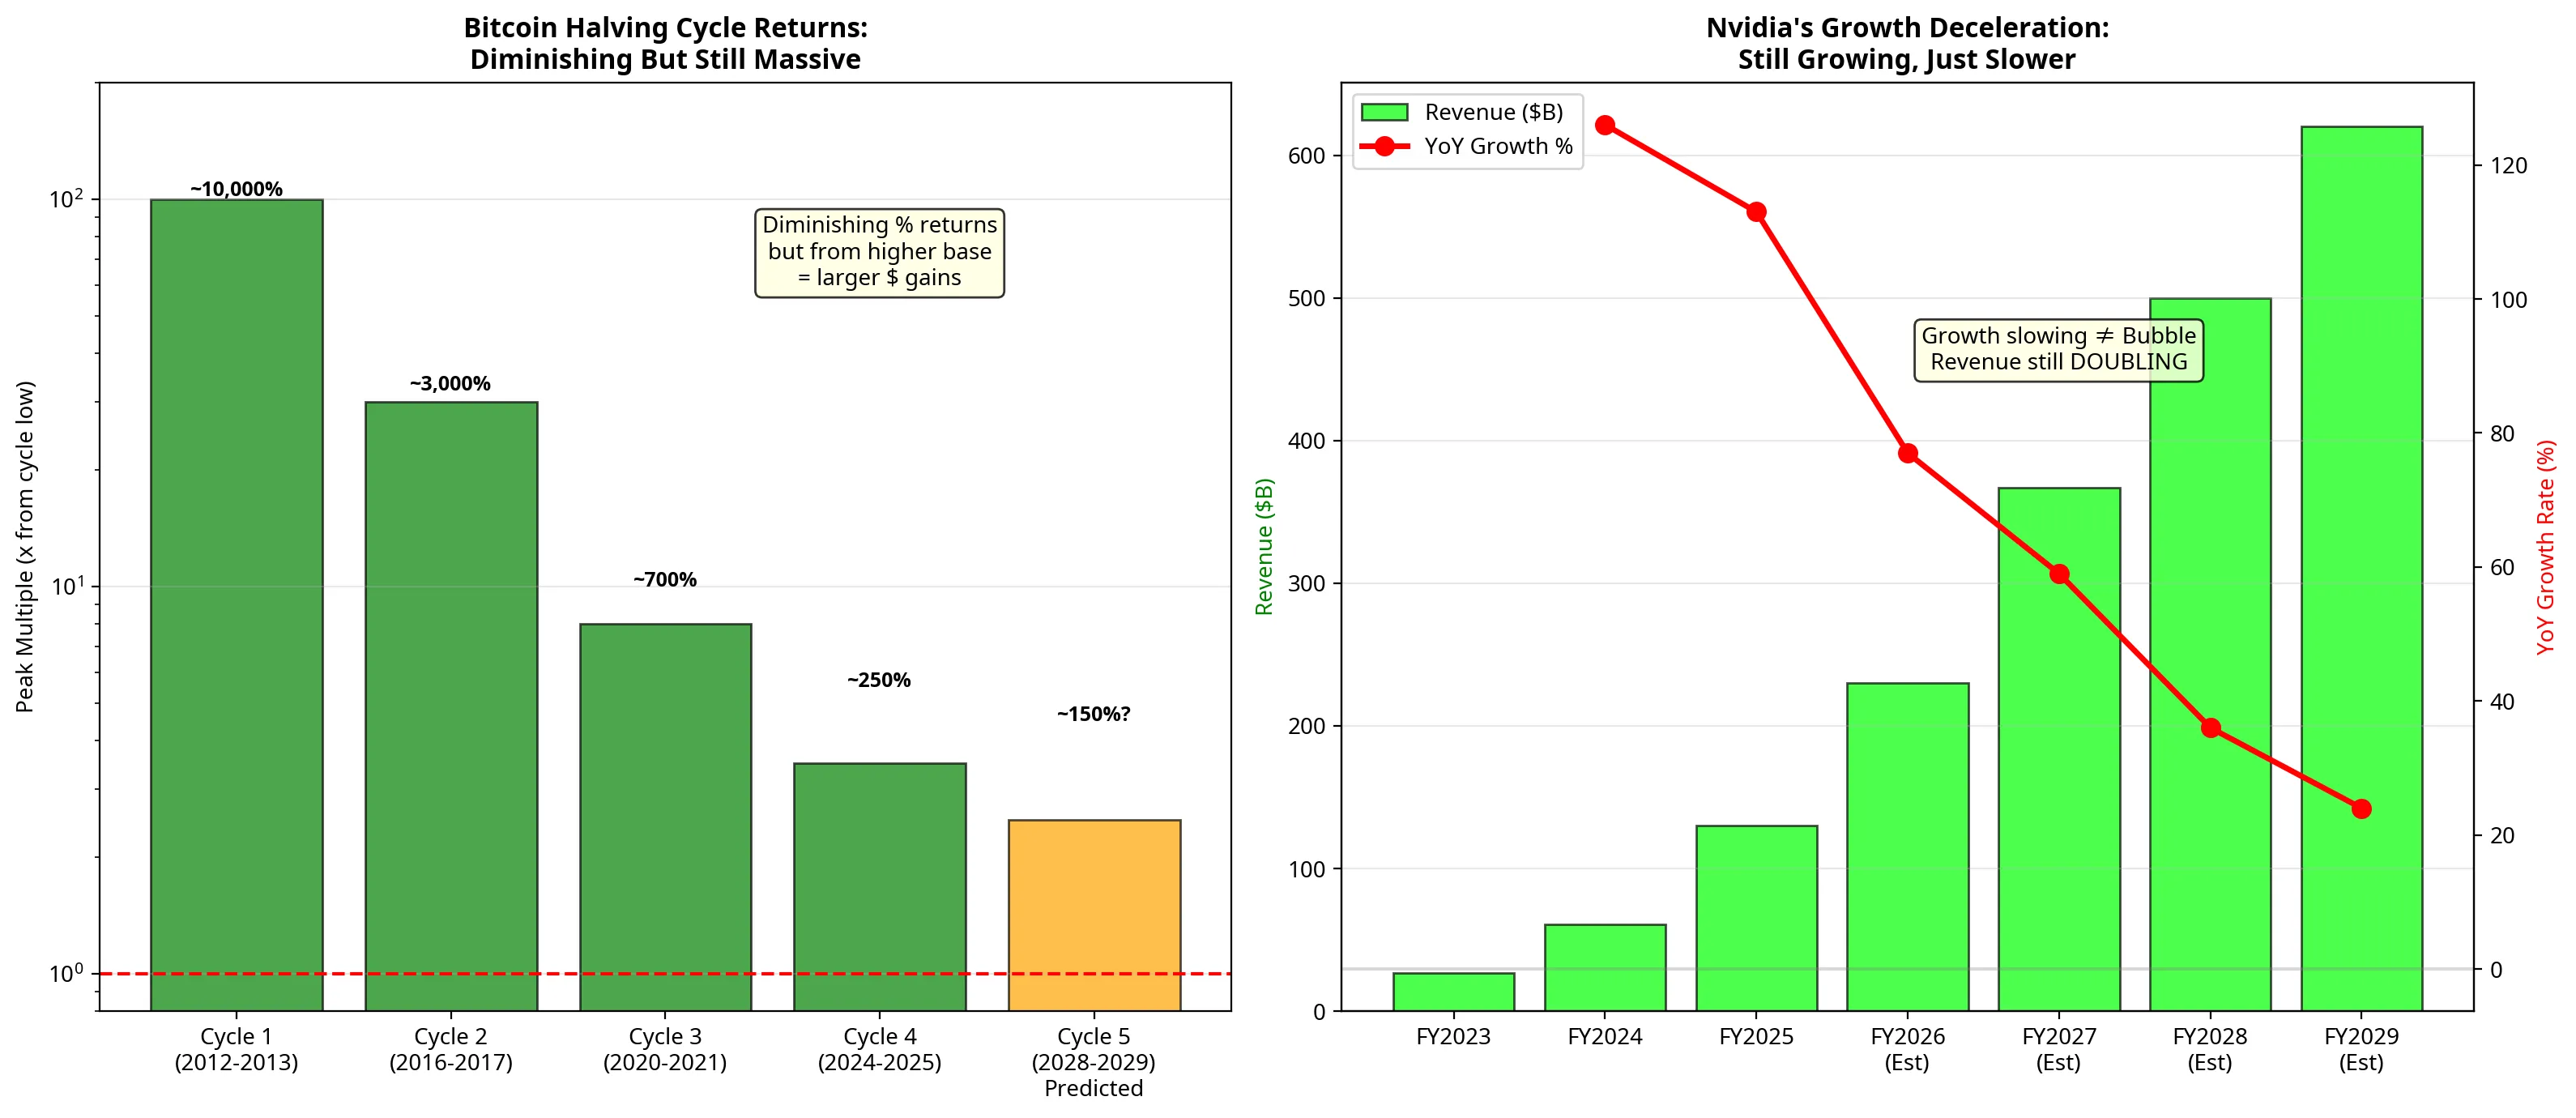
If you examine Bitcoin’s rolling CAGR, it trends diagonally downward over time. This does not mean Bitcoin is failing; it means it is maturing. A jump from $100 to $10,000 is a 10,000% return. A jump from $65,000 to $350,000 is “only” a 438% return, yet it represents a vastly larger absolute dollar gain.
The same applies to Nvidia. Doubling revenue from $30 billion to $60 billion is impressive, but growing from $230 billion to $367 billion requires an unprecedented scale of capital expenditure from hyperscalers. Investors must accept that the era of 100x returns in these specific mega-cap assets is likely behind us, but their ability to outpace the 5.5% M2 hurdle remains highly probable.
Price Predictions: 2030 and 2035
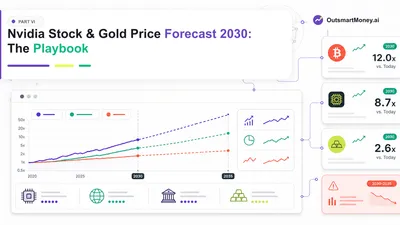
Based on current fundamentals, M2 projections, and historical growth decay models, we have mapped base-case scenarios for the next decade.
Base Case Forecasts (2026 to 2035):
| Asset | Current (2026) | 2030 Forecast | 2035 Forecast | Nominal Multiple |
|---|---|---|---|---|
| Bitcoin | $65,000 | $350,000 | $650,000 | 10.0x |
| Nvidia | $207 | $580 | $1,050 | 5.1x |
| Nasdaq | 21,500 | 33,800 | 59,600 | 2.8x |
| Berkshire | $490 | $744 | $1,254 | 2.6x |
| Gold | $4,345 | $6,362 | $10,246 | 2.4x |
| M2 Supply | $22.8T | $28.2T | $36.9T | 1.6x |
Note: These are modelled projections, not guarantees. They assume a 5.5% annual M2 expansion and a normalisation of tech P/E multiples.
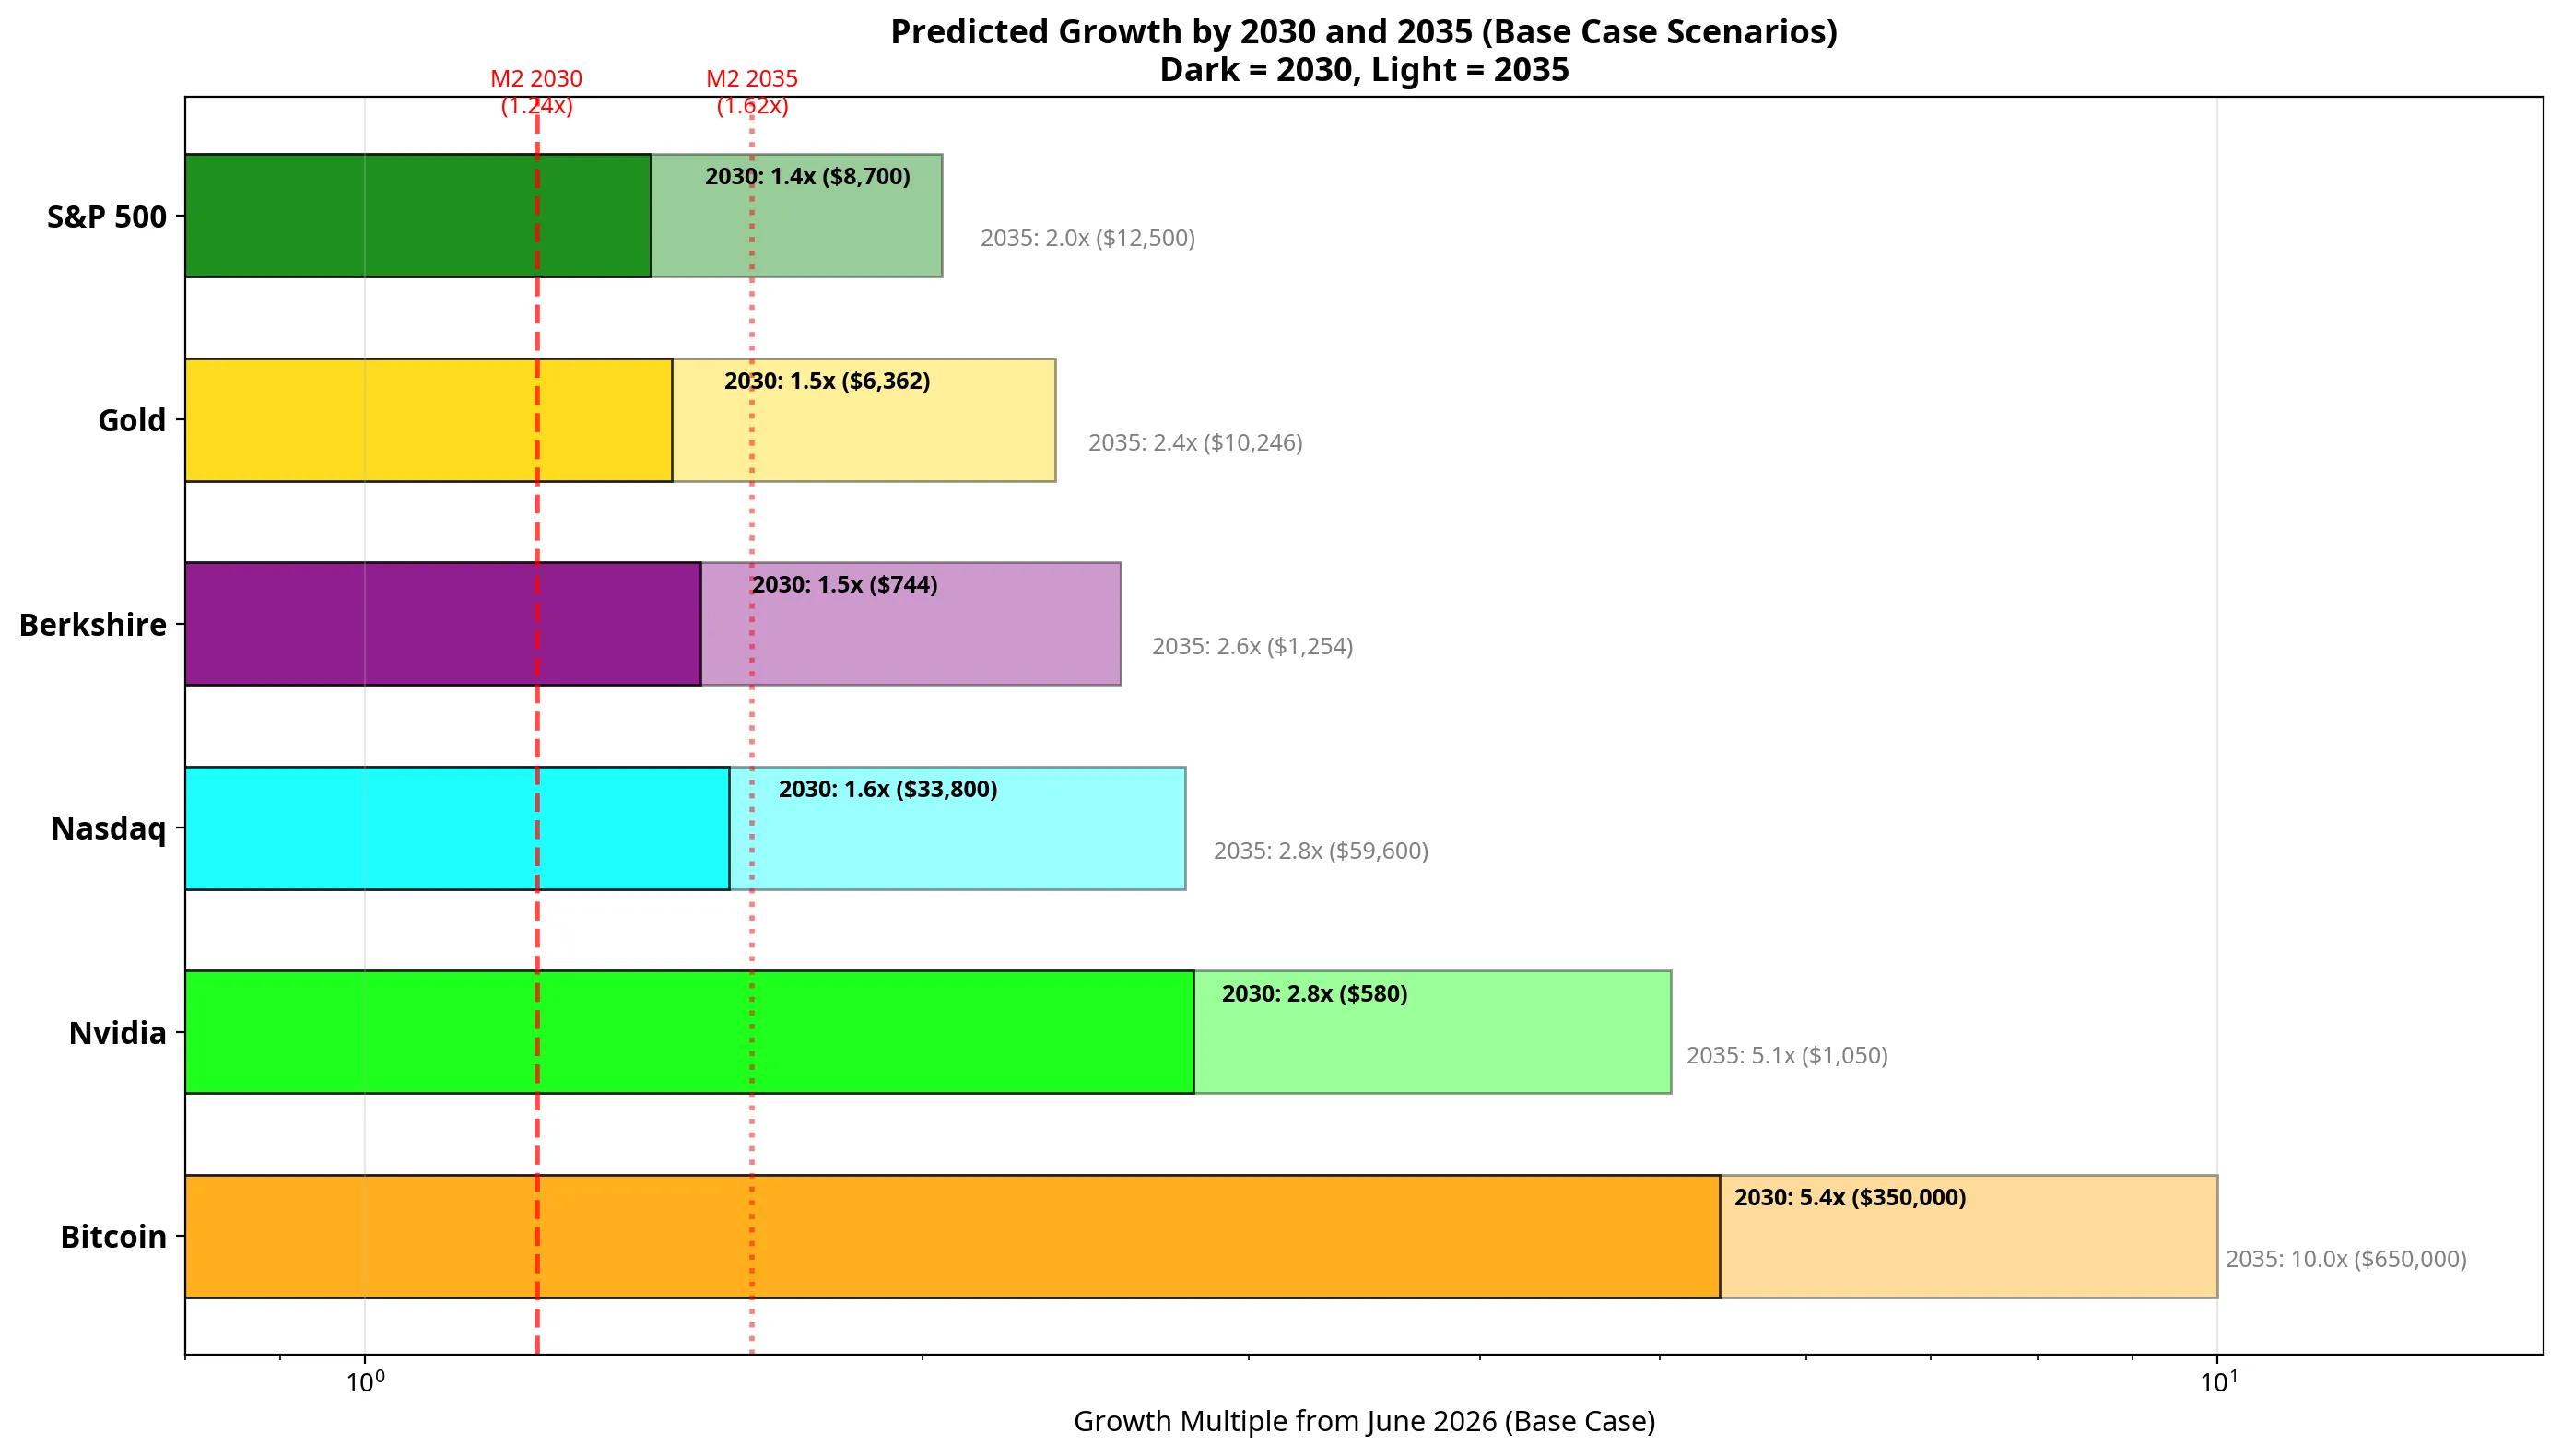
The summary chart above consolidates these projections across all scenarios. Even in the bear case, Bitcoin and Nvidia are projected to outpace money supply expansion, though the margin of safety narrows considerably.
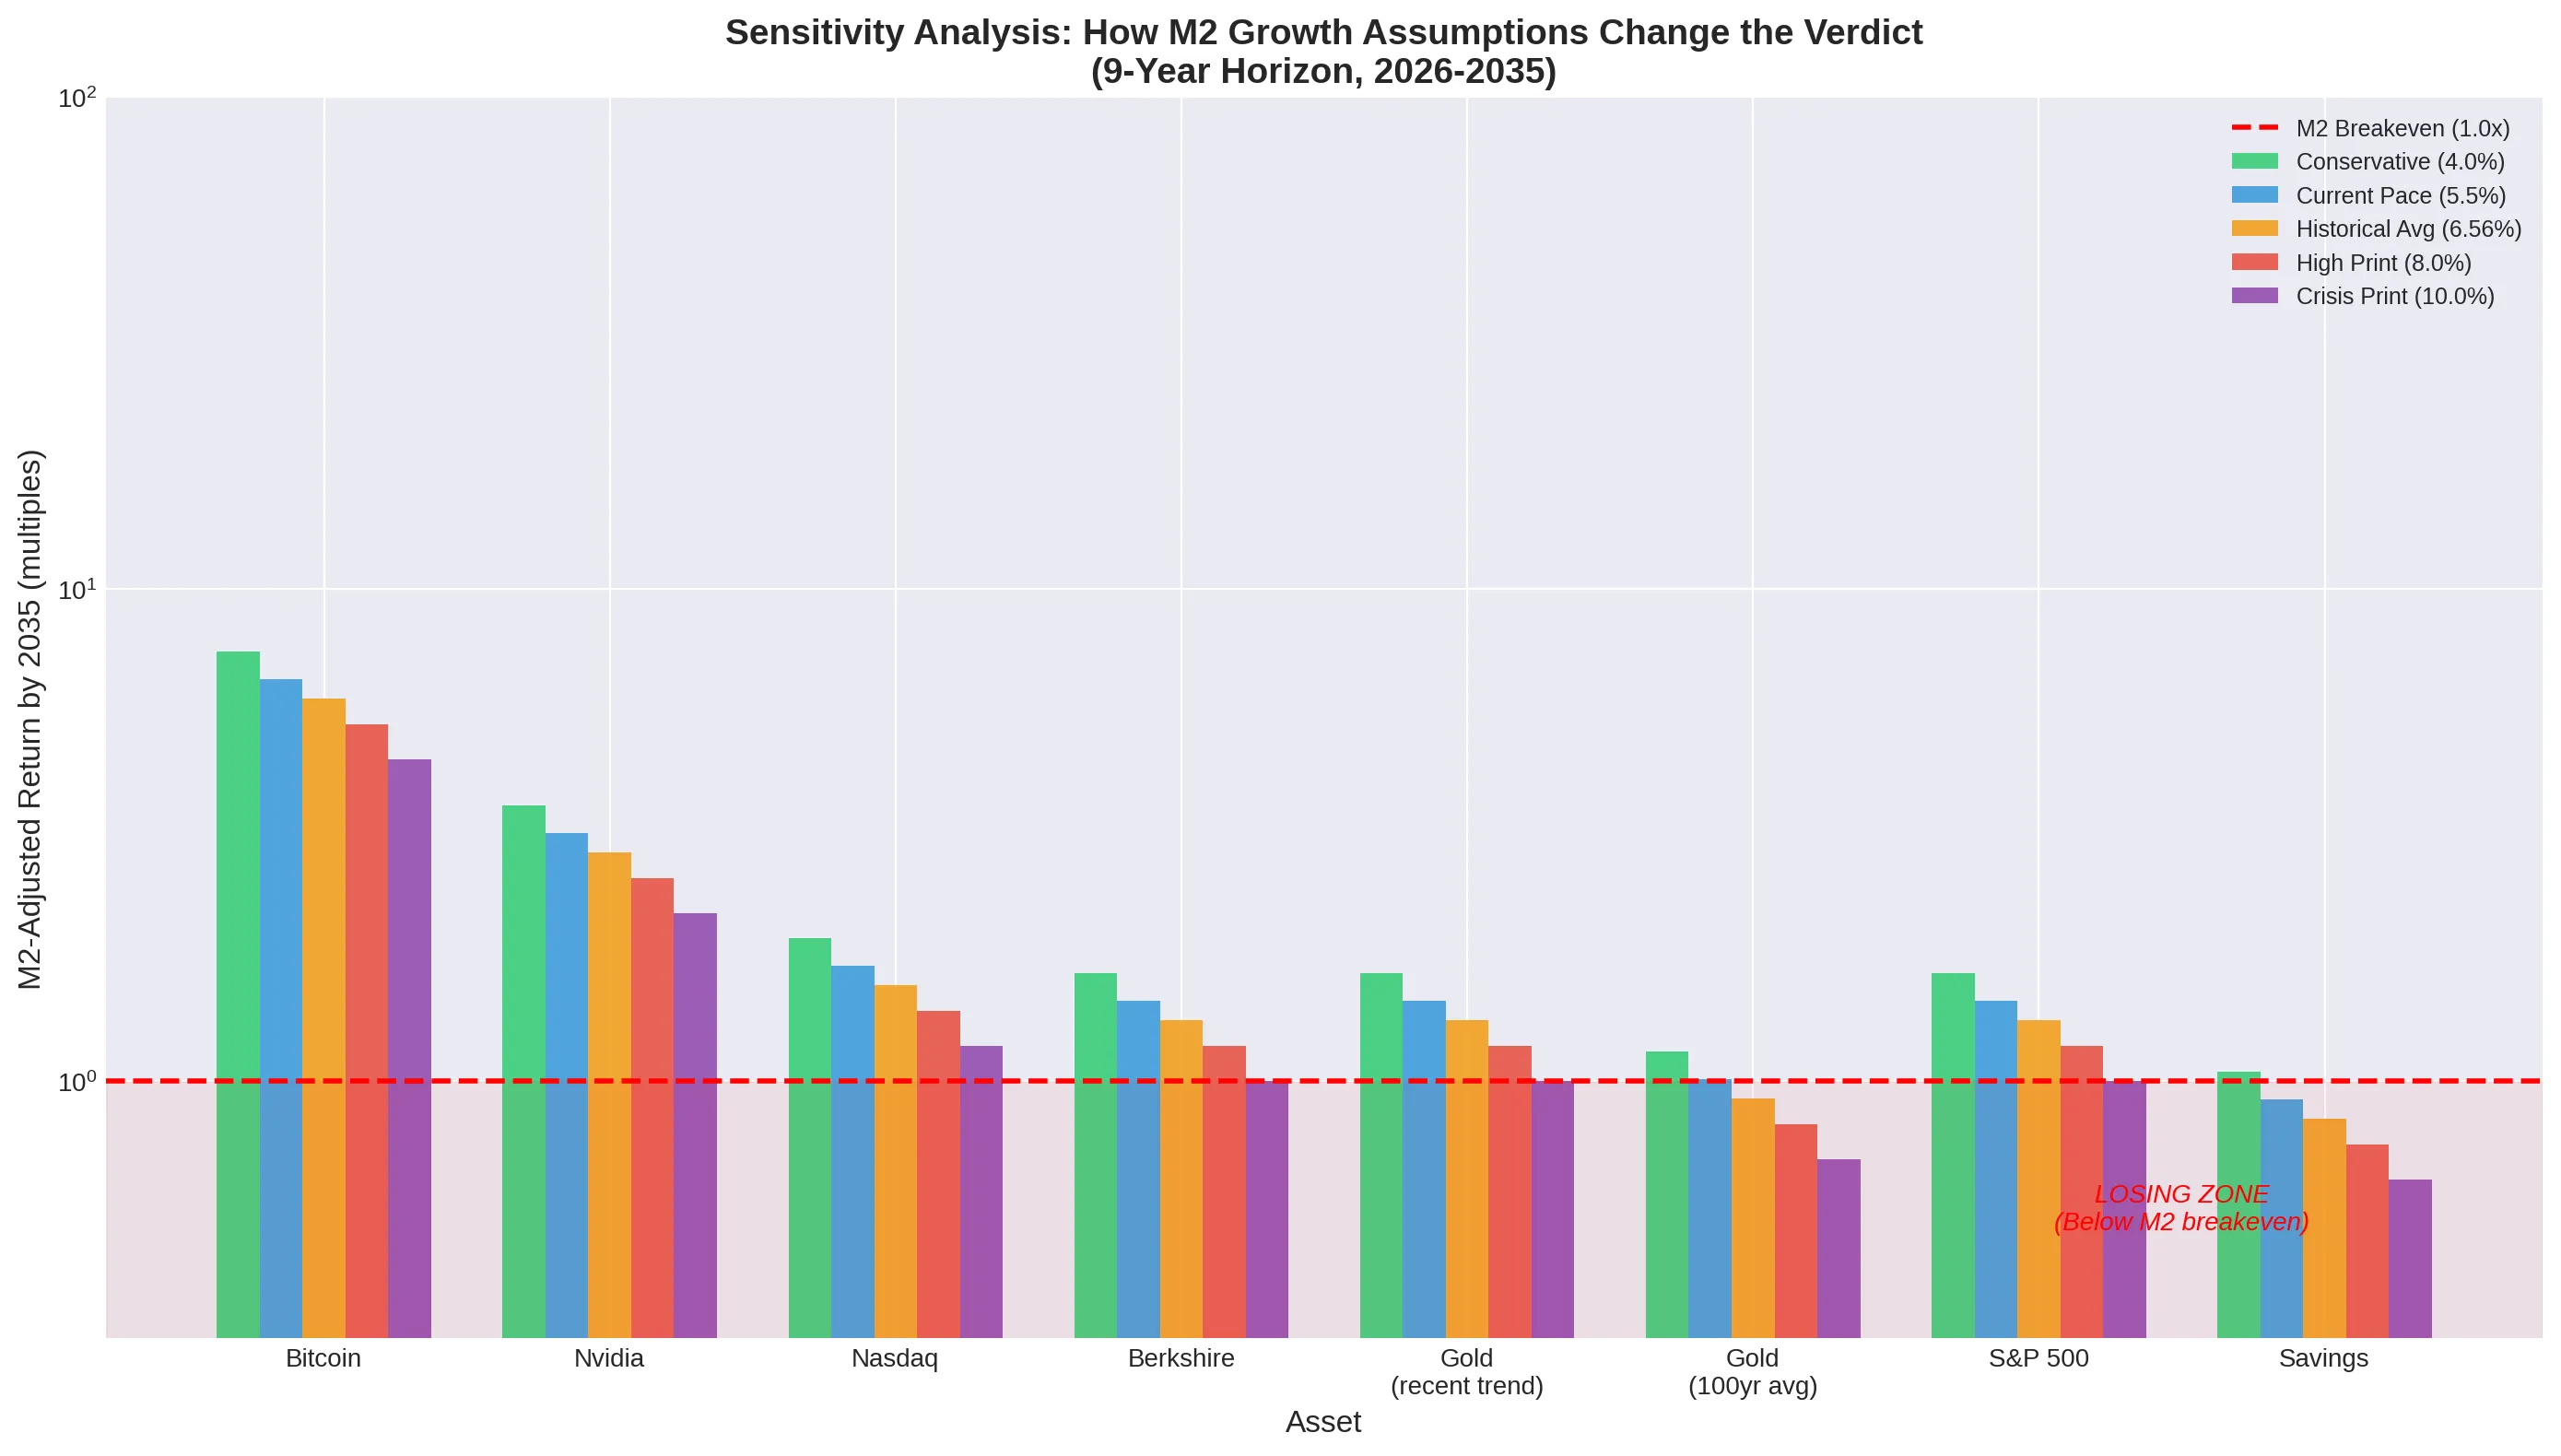
The sensitivity analysis reveals a telling insight: the faster the money supply expands, the higher the nominal price of every asset, but only those with genuine scarcity or structural earnings growth deliver real returns. Under aggressive monetary expansion (7%+ M2 growth), Bitcoin’s outperformance widens, whilst gold and Berkshire struggle to break even in real terms.
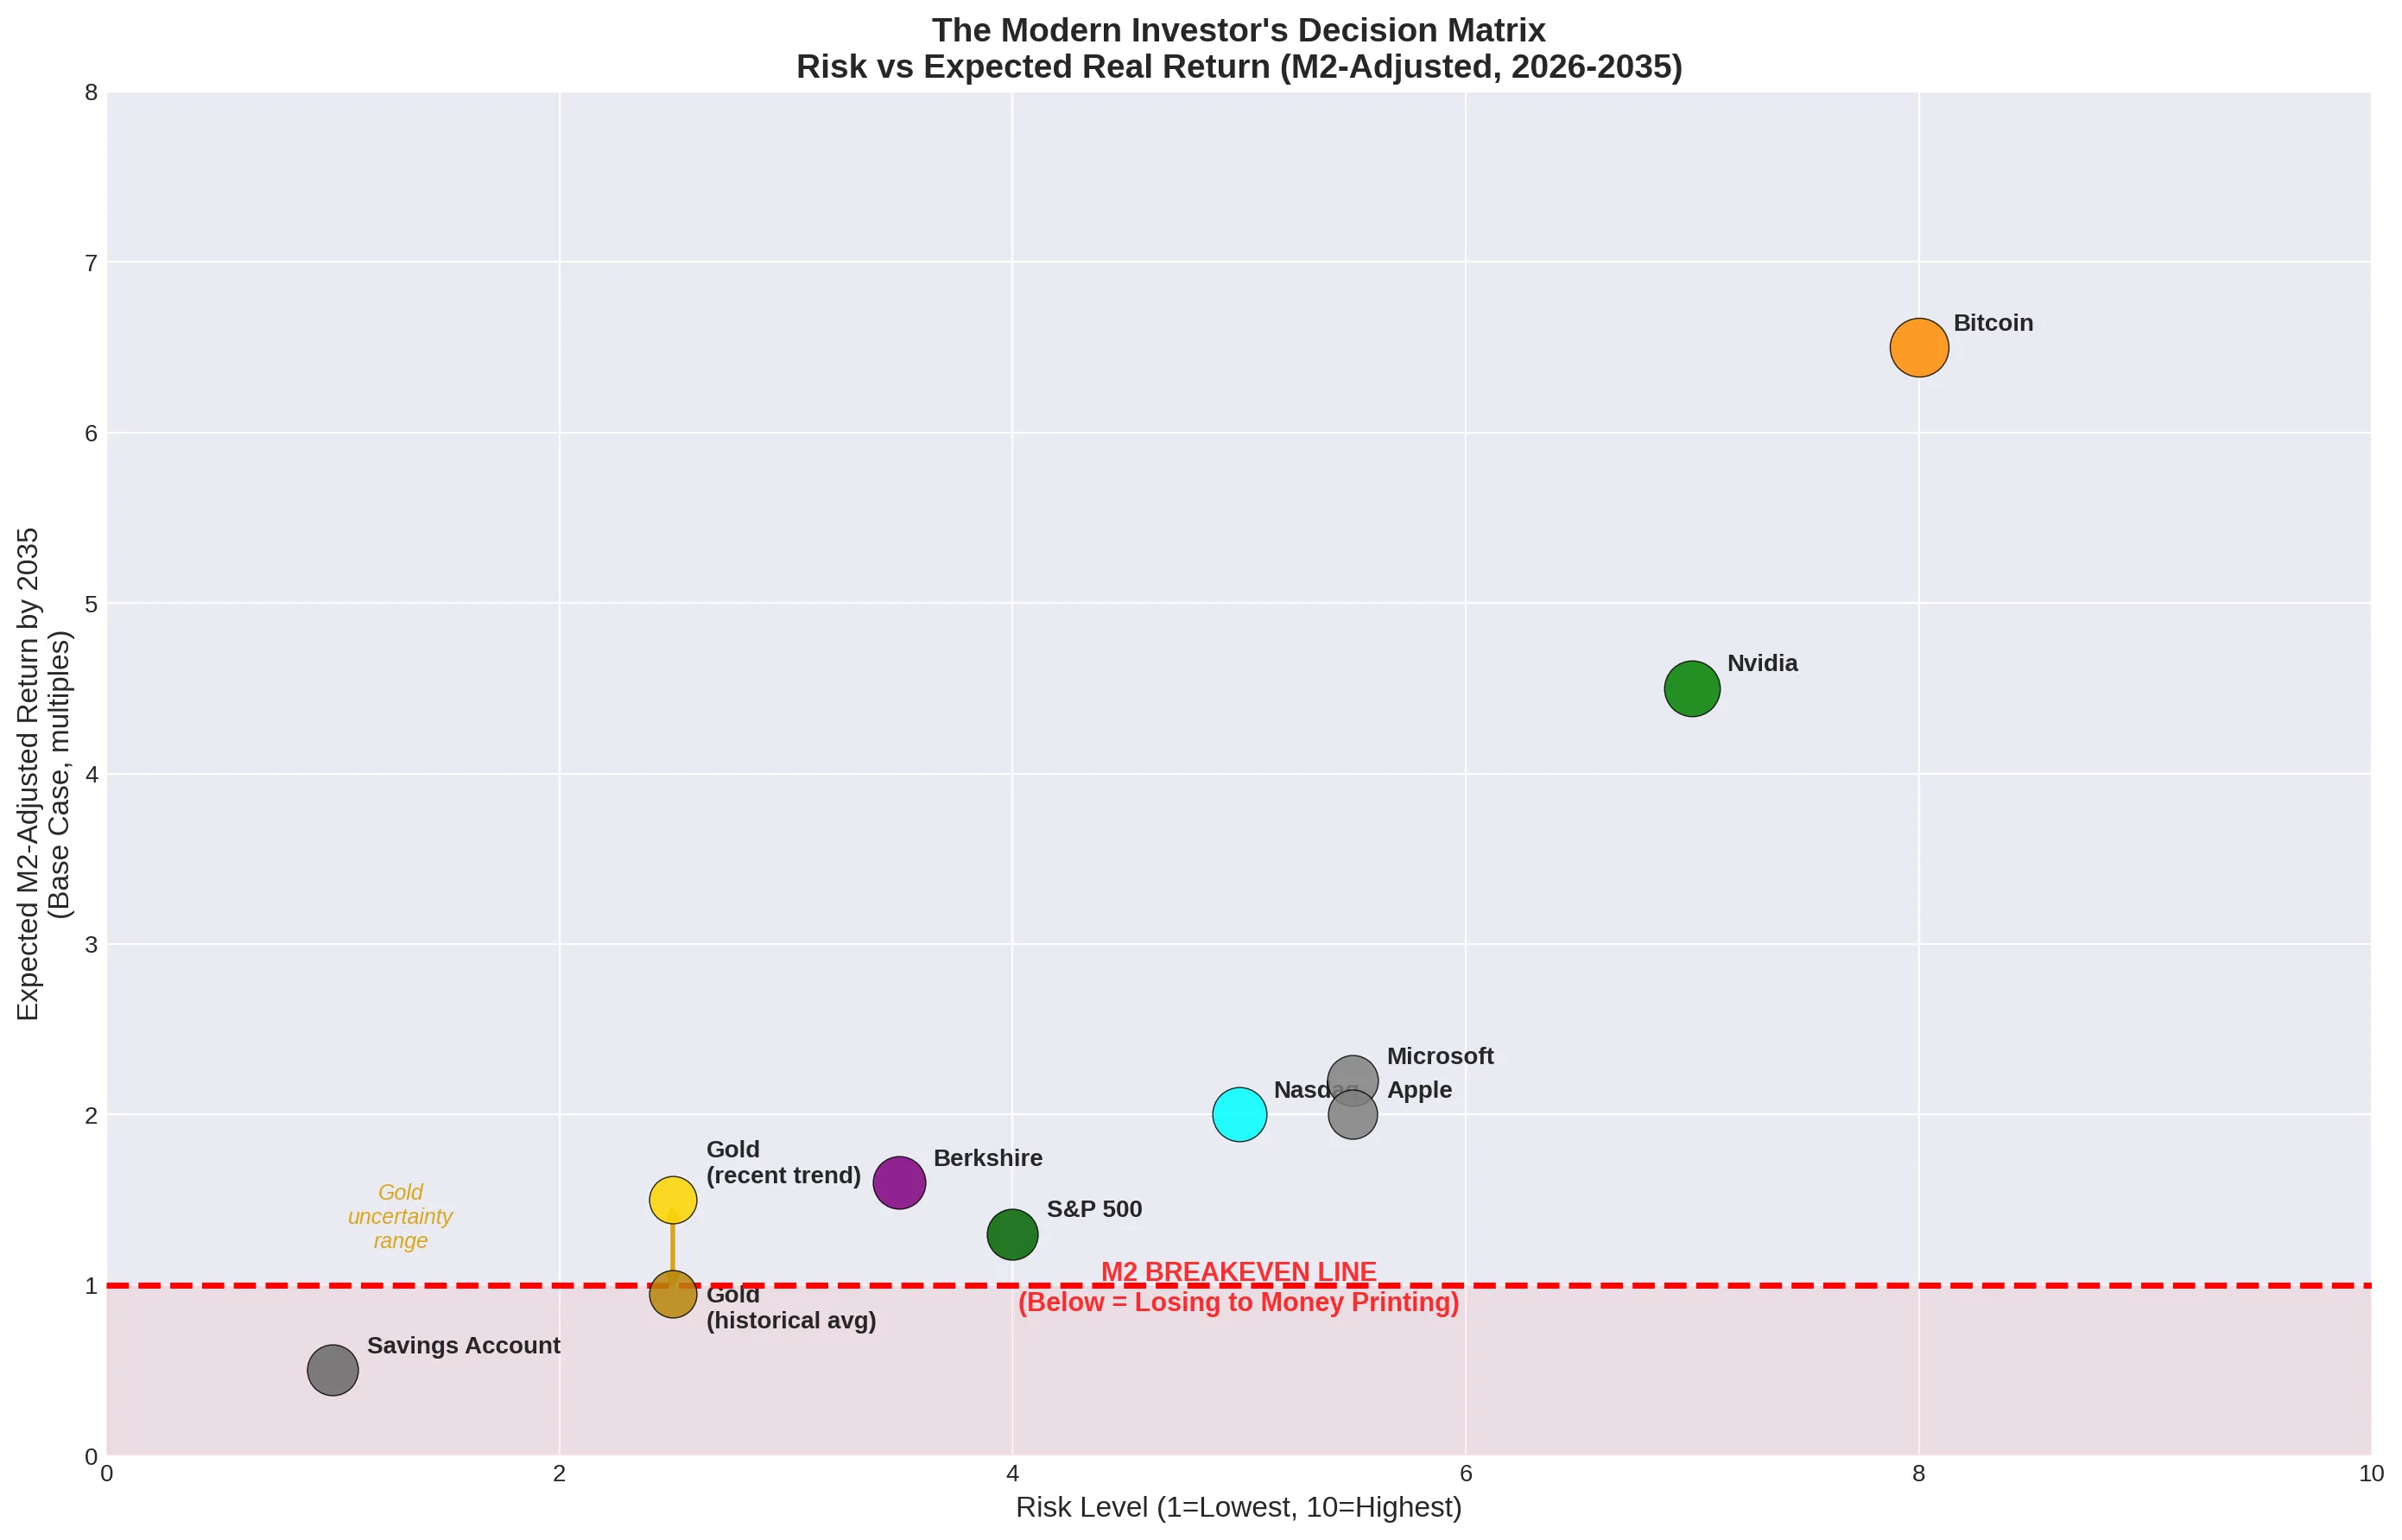
The Real Test: M2-Adjusted Returns
Nominal price targets are an illusion. The only metric that matters is whether an asset’s purchasing power expands faster than the money supply.
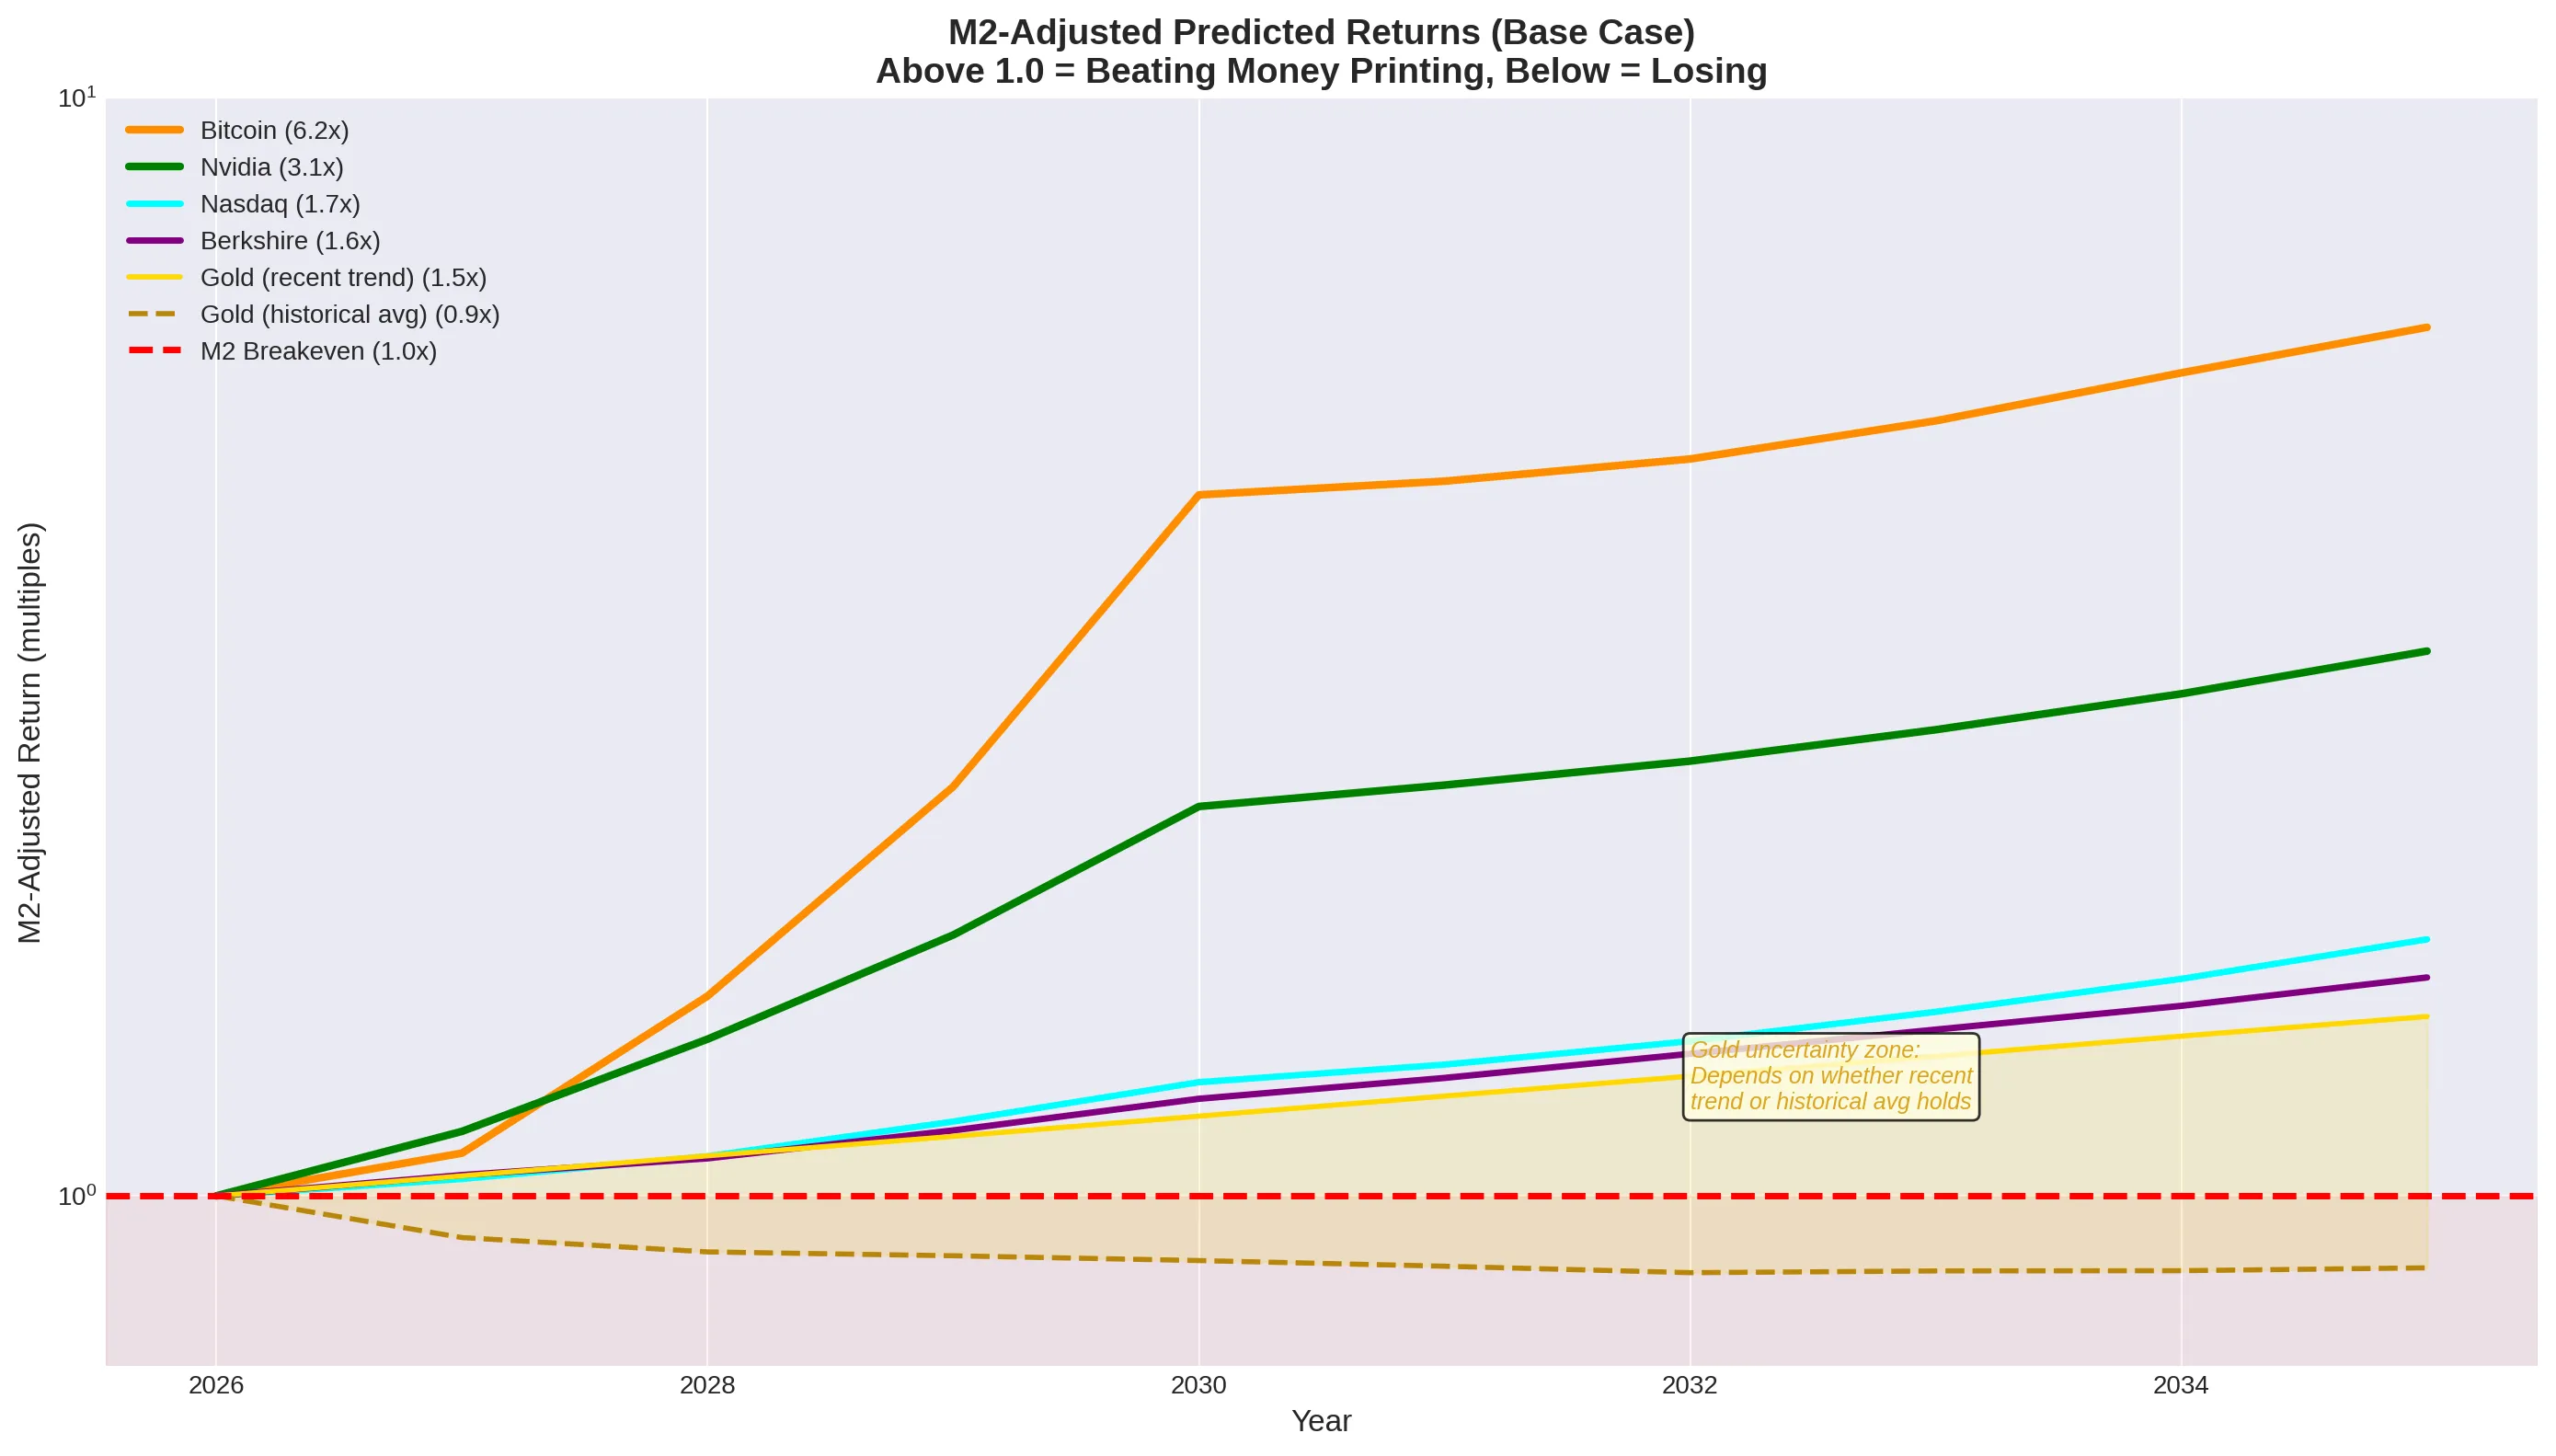
By 2035, M2 is projected to expand by roughly 1.6x. If an asset does not grow by at least 1.6x, the investor has lost real wealth.
In our base-case model:
- Bitcoin delivers a 6.2x real return (adjusted for M2).
- Nvidia delivers a 3.1x real return.
- Nasdaq delivers a 1.7x real return.
- Berkshire Hathaway and Gold barely clear the hurdle at 1.6x and 1.5x real returns, respectively.
Bitcoin vs. Gold: The Scarcity Paradox
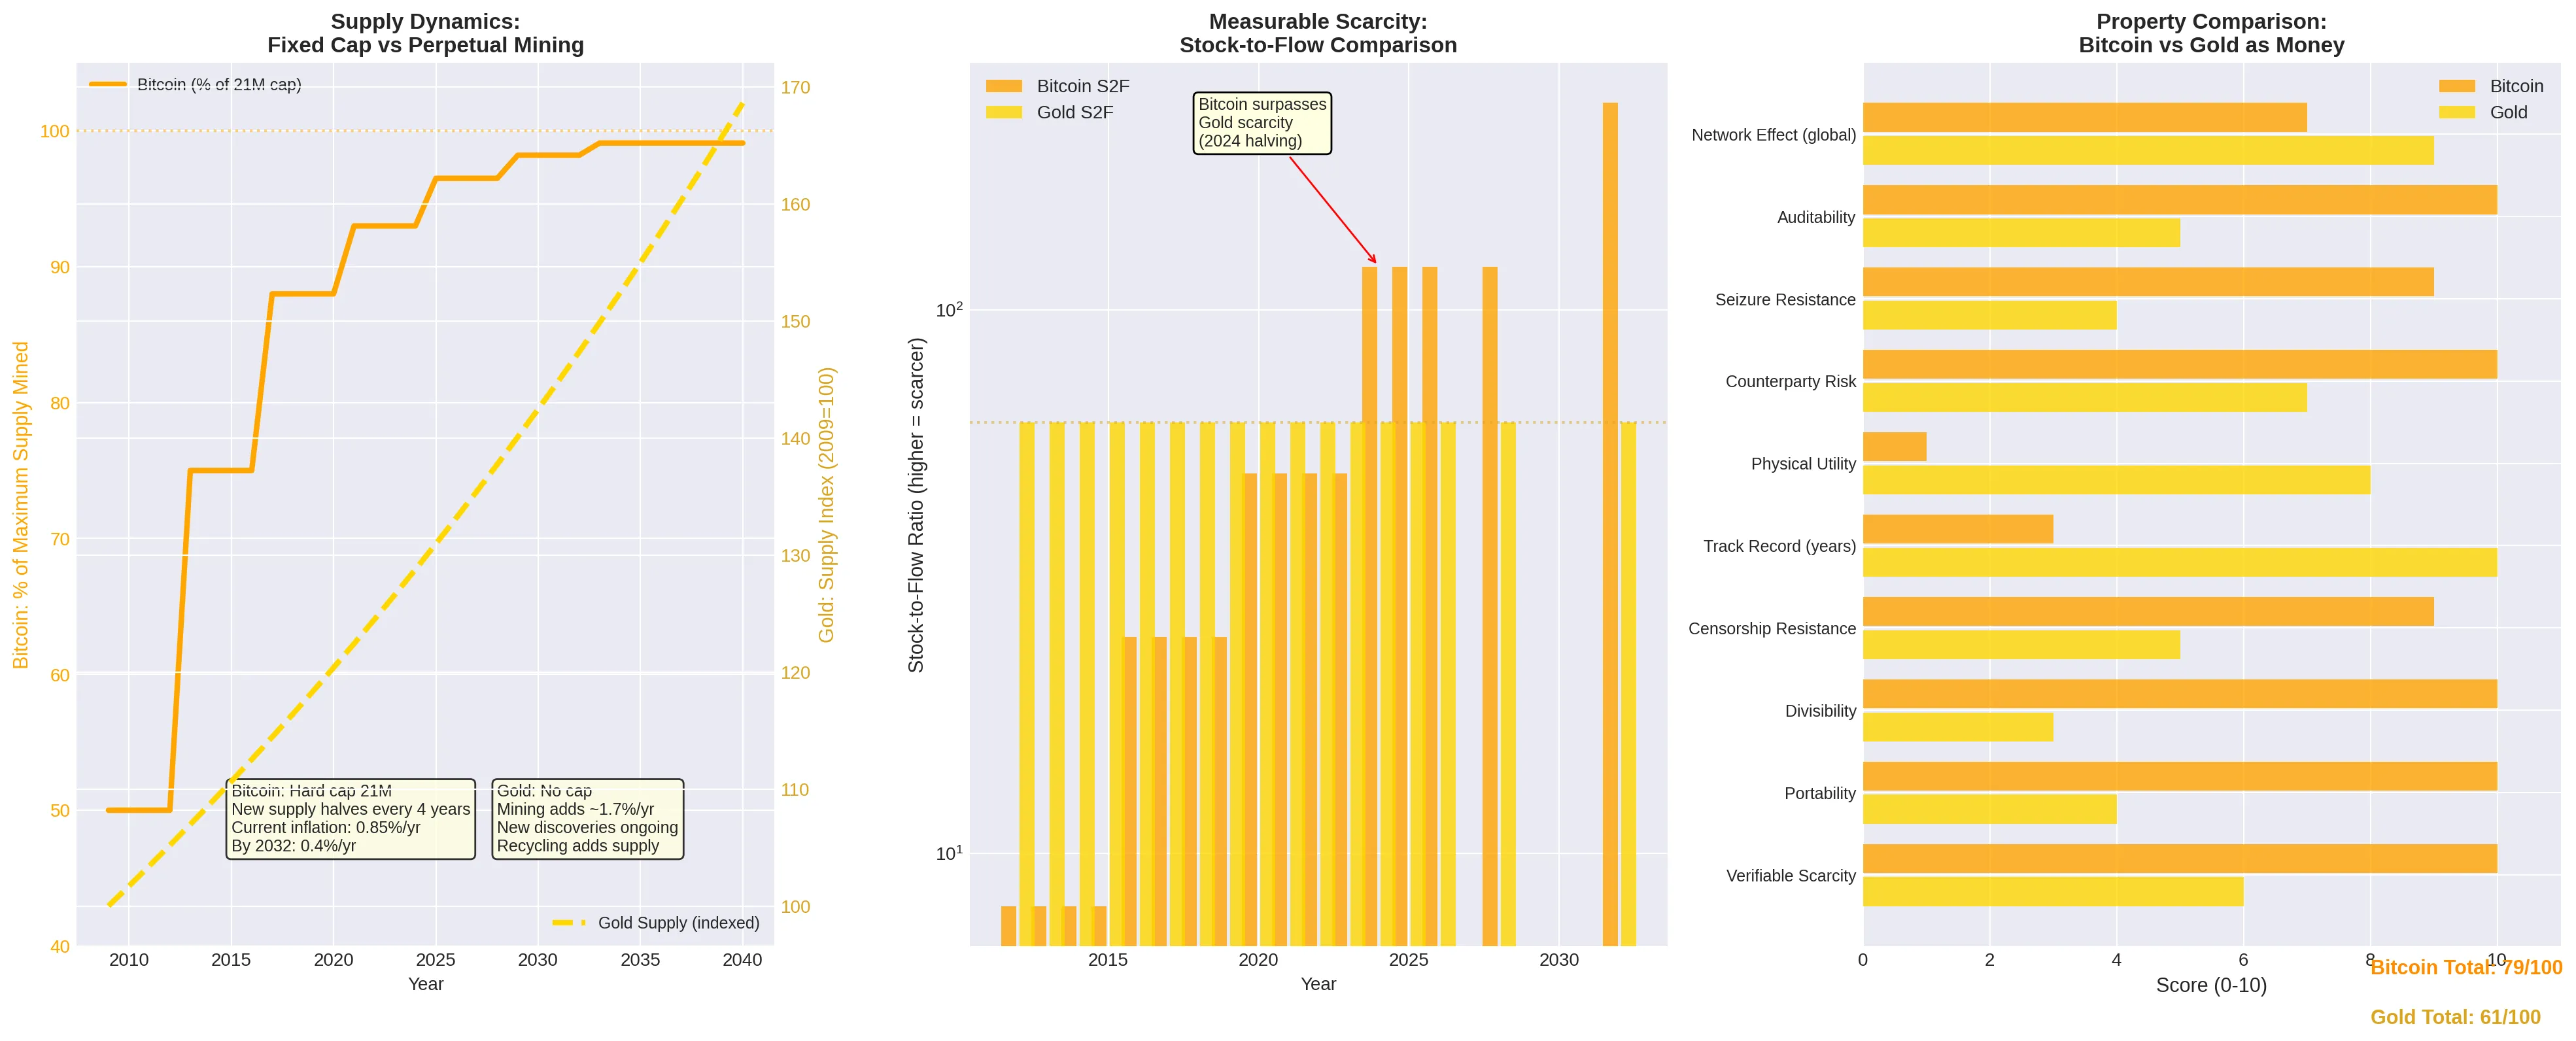
Gold has served as a store of value for millennia, but its supply is not truly fixed. Annual mining adds roughly 1.5% to the above-ground stock, and there is no theoretical cap. Bitcoin, by contrast, has a mathematically enforced ceiling of 21 million units. When both assets are priced against M2, Bitcoin’s scarcity premium becomes plainly visible.
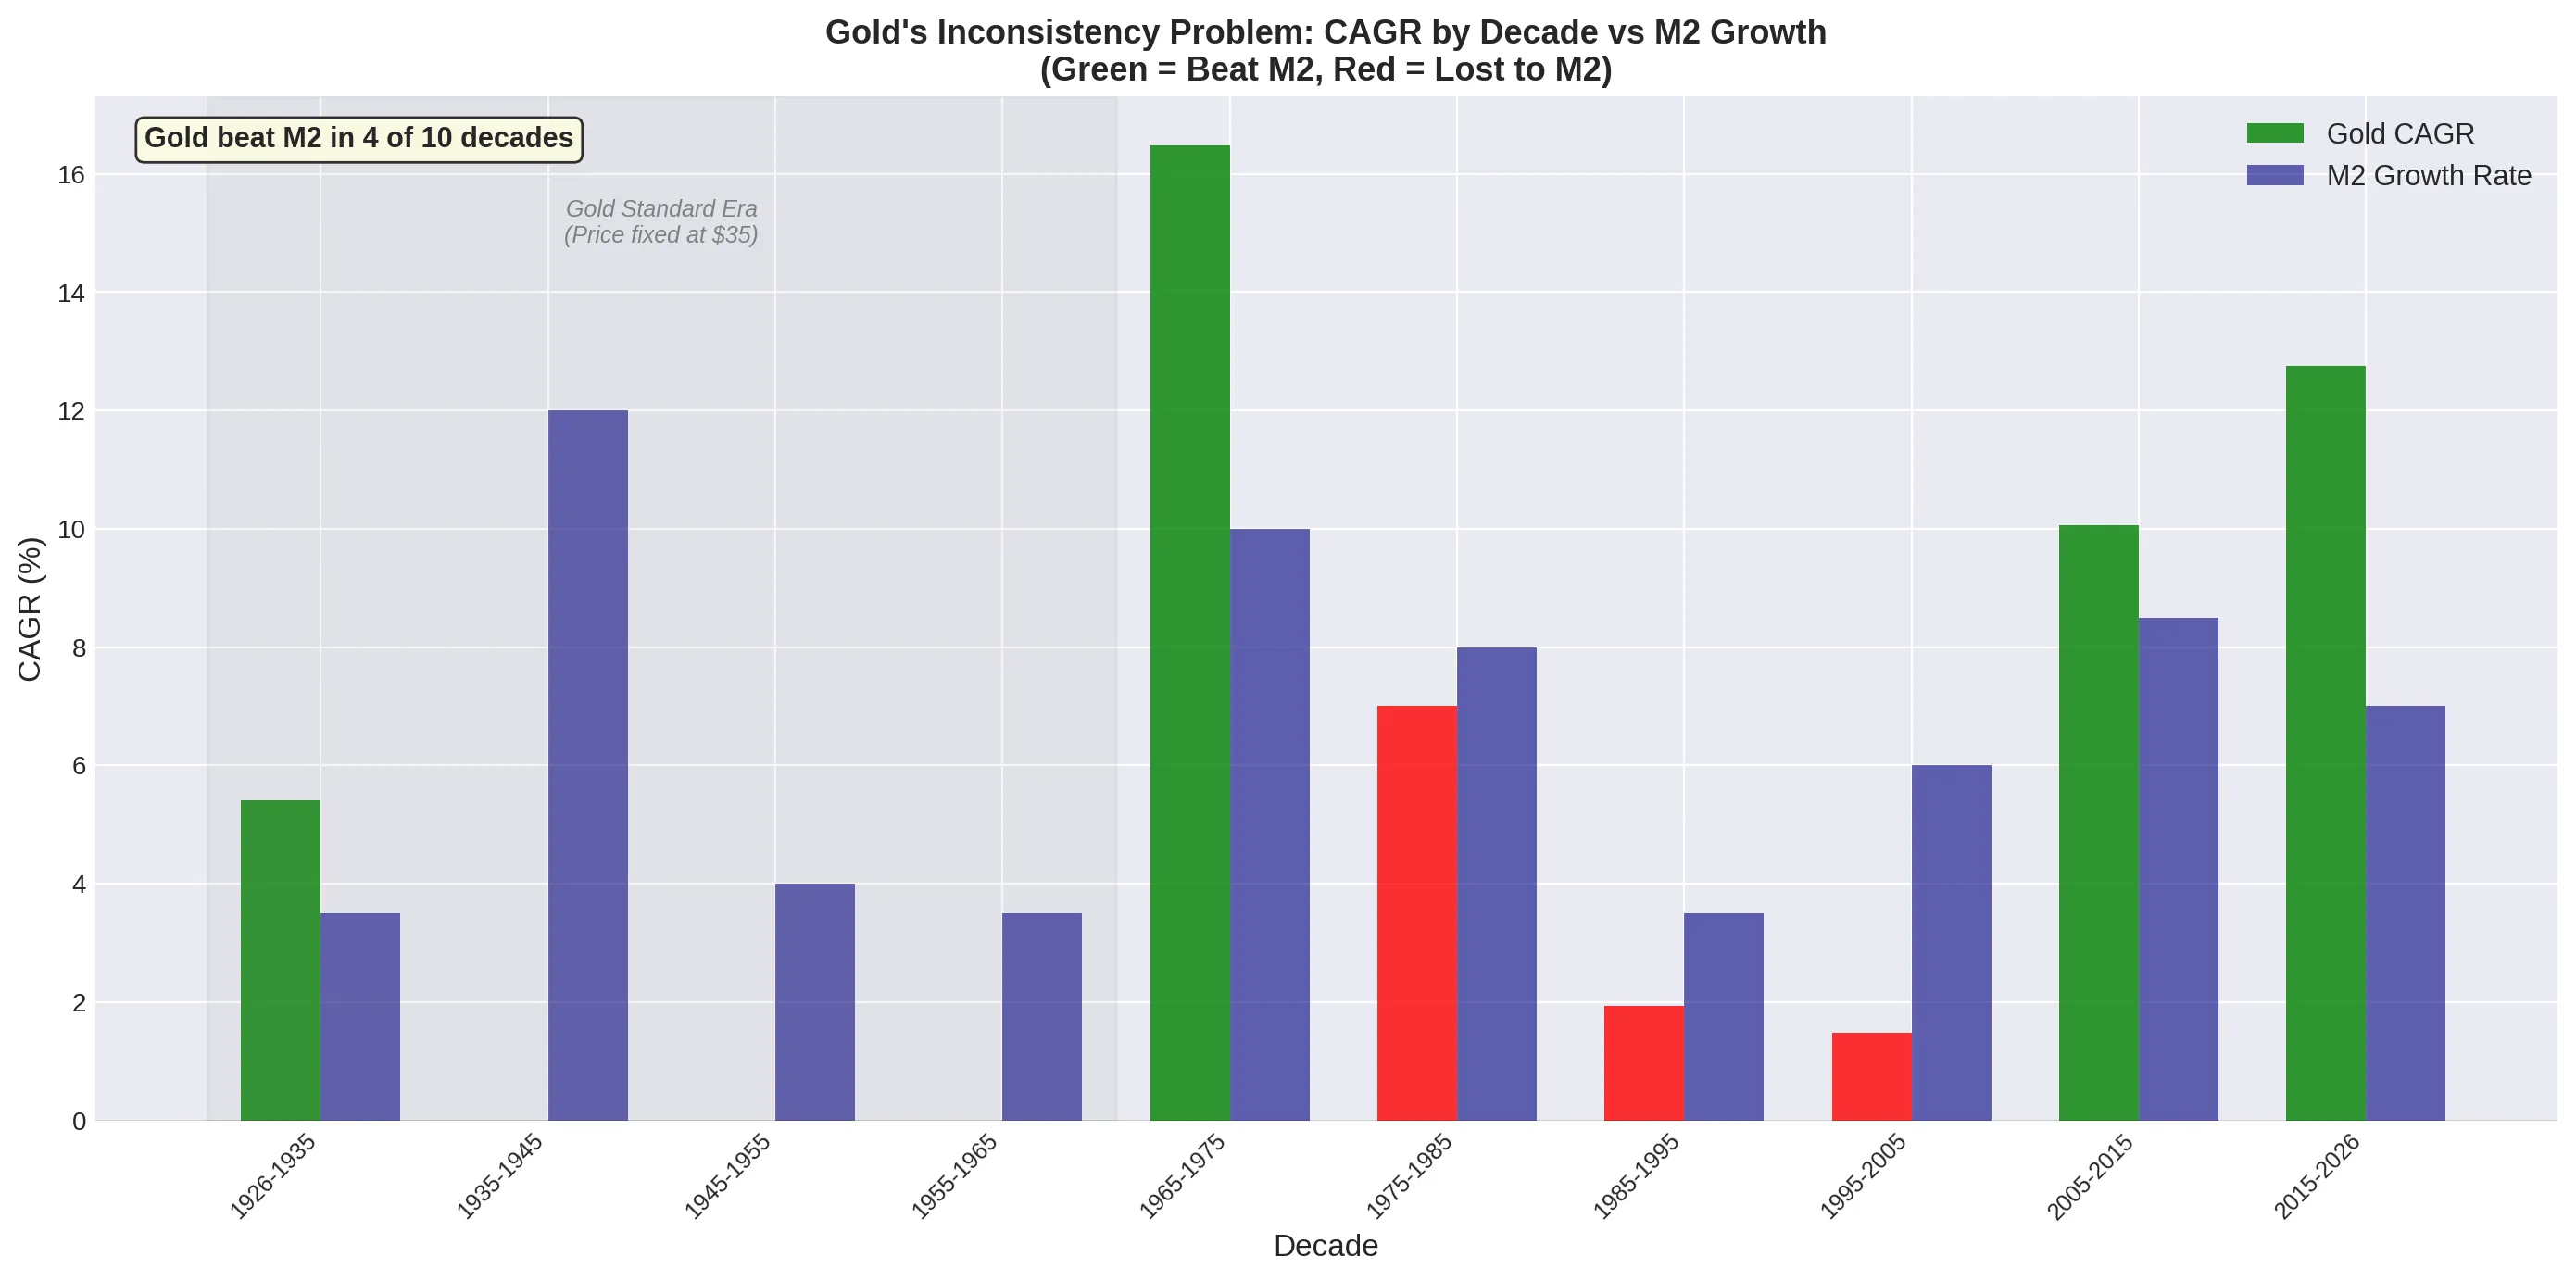
Gold’s track record as an inflation hedge is surprisingly inconsistent. Between 1980 and 2000, gold fell by over 60% in nominal terms whilst the money supply tripled. Its performance correlates more closely with sentiment and geopolitical anxiety than with monetary expansion. For investors seeking a pure mathematical hedge against currency debasement, Bitcoin offers a structurally superior framework, though with significantly higher volatility.
The Modern Investor’s Decision Matrix
If Berkshire Hathaway was the definitive “safe” compounder of the 20th century, the Nasdaq Composite has arguably taken its place in the 21st century.
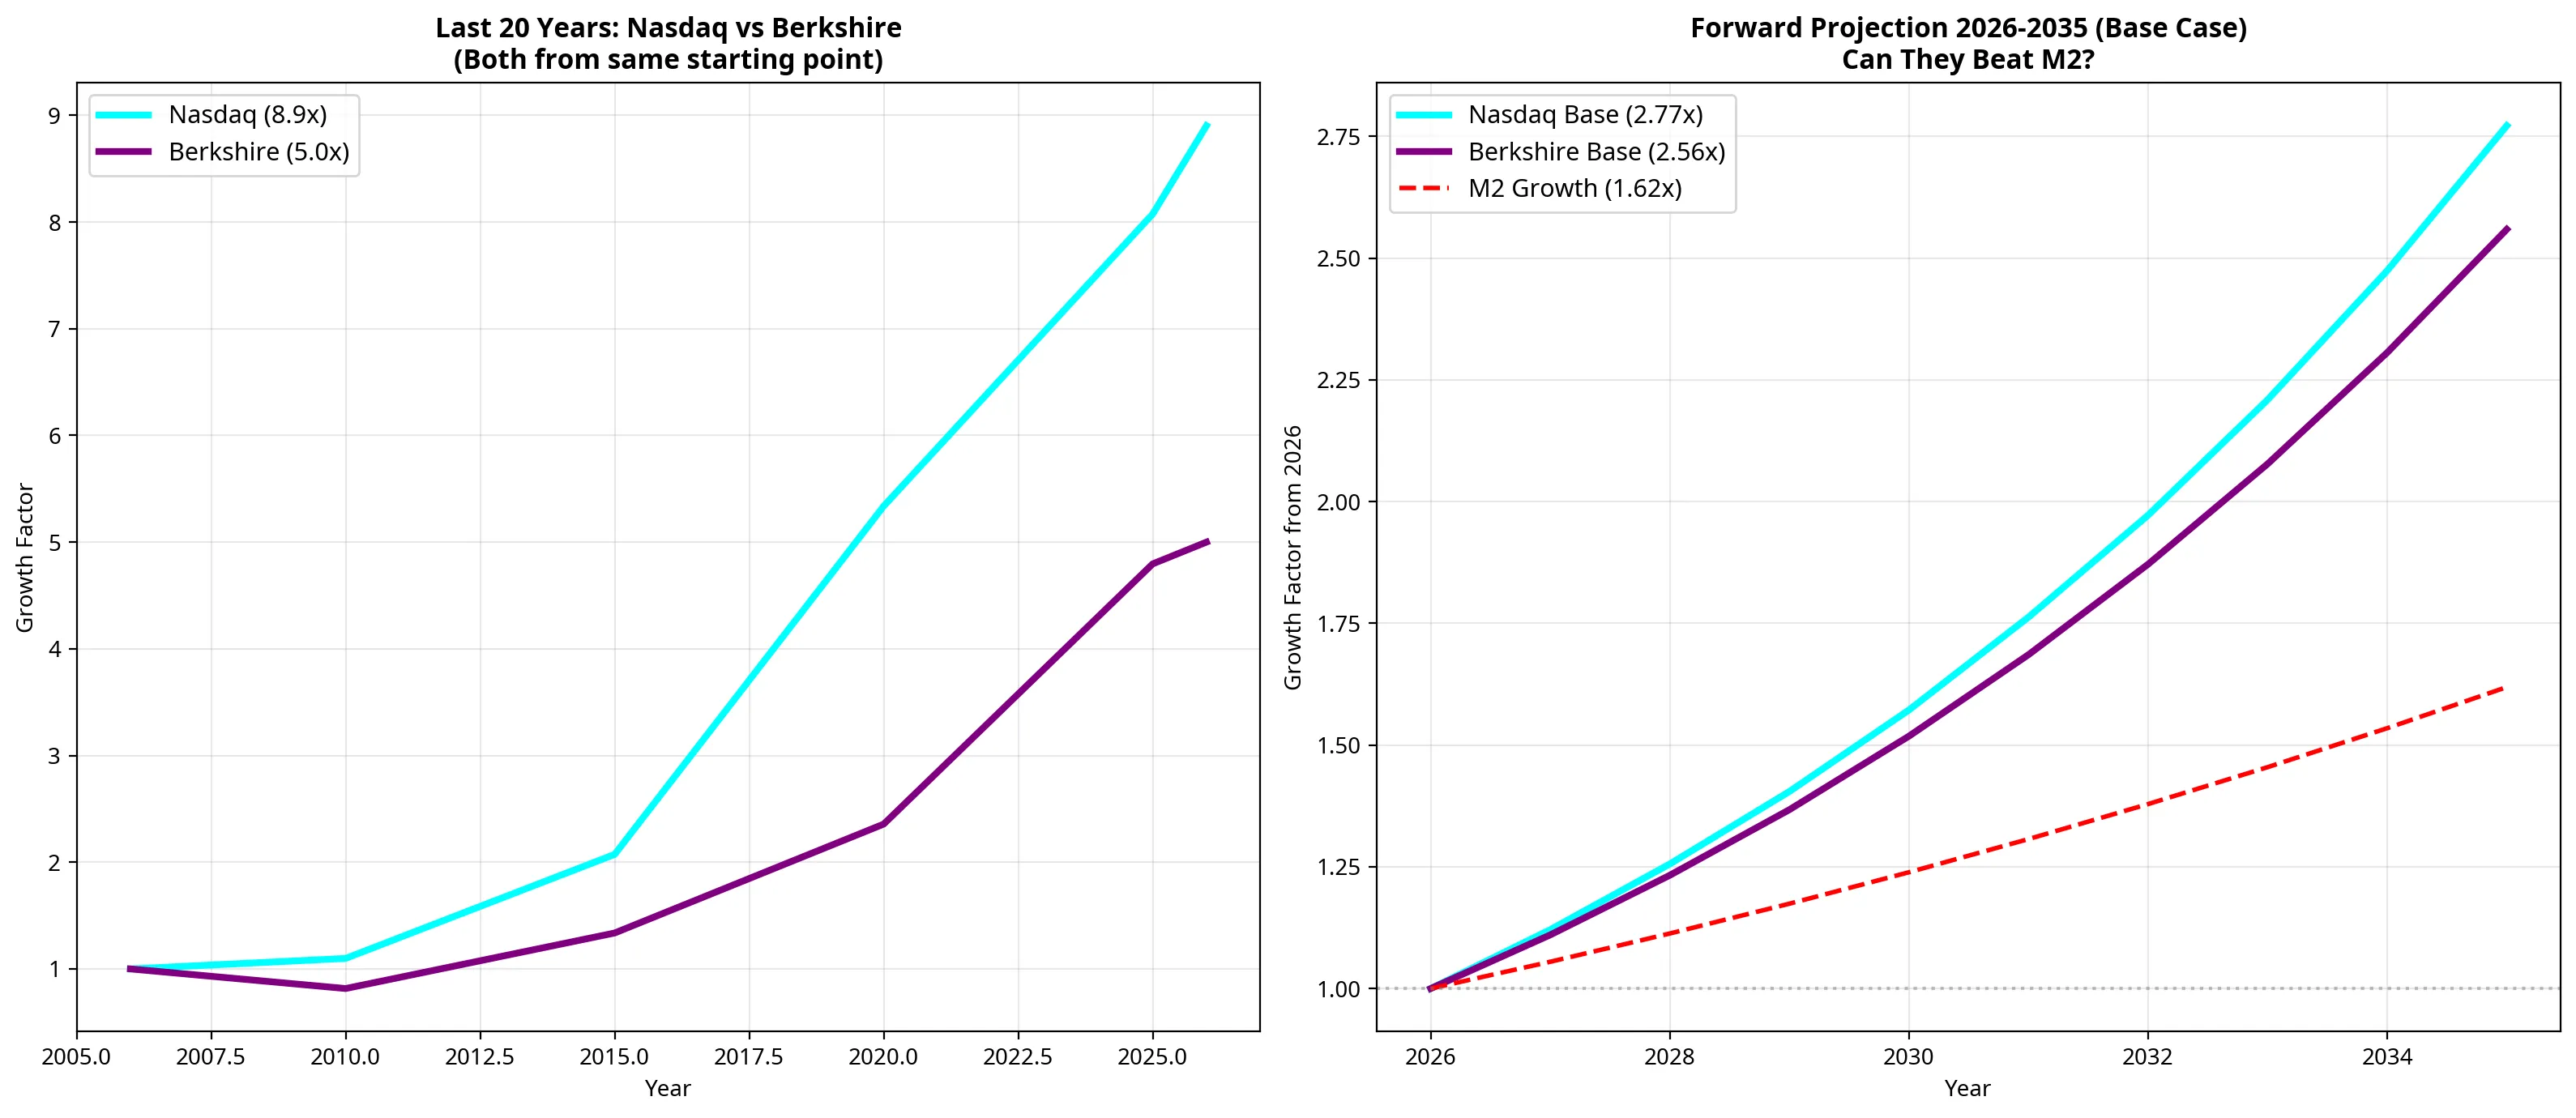
Whilst Berkshire requires faith in the capital allocation skills of a single management team (in a post-Buffett era), the Nasdaq provides automated, diversified exposure to the companies building the future of human infrastructure.
For the modern investor constructing a portfolio today, the options fall along a clear risk-reward spectrum:
- The Baseline (Cash/Savings): Guaranteed to lose 3% to 5% of its purchasing power annually. It is a melting ice cube.
- The Preservers (Gold & Berkshire): Likely to maintain purchasing power and slightly beat M2, offering a “sleep at night” foundation with limited upside.
- The Modern Compounder (Nasdaq): The optimal balance of diversification and tech-driven growth. It is the new default for beating the printing press.
- The High-Conviction Bet (Nvidia/Mega-Cap Tech): Offers superior returns backed by massive cash flows, but carries the inherent risk of single-company disruption or regulatory action.
- The Asymmetric Hedge (Bitcoin): Carries the highest volatility, but its absolute scarcity makes it the mathematically perfect counter-trade to infinite fiat expansion.
The Final Verdict: The 100-year history of the US dollar proves that conservative investing is often the riskiest path of all. To stand still is to fall behind. In an era where the money supply expands by trillions, holding scarce digital assets and the companies building the AI infrastructure of tomorrow is no longer speculation. It is the baseline requirement for financial survival.
References
[1] Federal Reserve Economic Data (FRED). “M2 Money Supply (M2SL).” May 2026. [2] Simply Wall St. “NVIDIA (NasdaqGS:NVDA) Stock Forecast & Analyst Predictions.” June 2026. [3] Yahoo Finance. “NVIDIA Corporation (NVDA) Valuation Measures.” June 2026.