The Illusion of Wealth (Part III)
Historical Asset Class Returns: The 100-Year Scorecard
This is Part III of the "Illusion of Wealth" series tracking 100 years of dollar value dilution.

Table of Contents
A full century-long comparison of every major asset class against the expansion of the M2 Money Supply.
Executive Summary
In Parts I and II, we established that most traditional “safe” investments, from housing and gold to savings accounts and the nominal price of the S&P 500, have failed to outpace the expansion of the US money supply over the last century.
This third and final part of the 100-year historical analysis introduces the remaining major asset classes: US Farmland, Crude Oil, Corporate Bonds, Long-Term Government Bonds, and US Small Cap Stocks. Just as importantly, we also test the impact of total return investing, specifically the S&P 500 with all dividends reinvested.
By putting every asset on a single scorecard, we can definitively answer the question: What could an investor have done to genuinely beat the printing press?
The answer is blunt: Only two strategies reliably created wealth above the rate of monetary dilution, and both required 100% dividend reinvestment in equities. Everything else was merely a leaky bucket.
The Grand Comparison
To create a fair comparison, we normalised every asset class to a starting value of 1.0 in 1928, the earliest year for which reliable, high-quality data exists across all categories [1] [2] [3].
Over the subsequent 97 years, the US M2 money supply expanded by a factor of 473x. Any asset that grew by less than 473x nominally lost purchasing power relative to the total monetary pool.
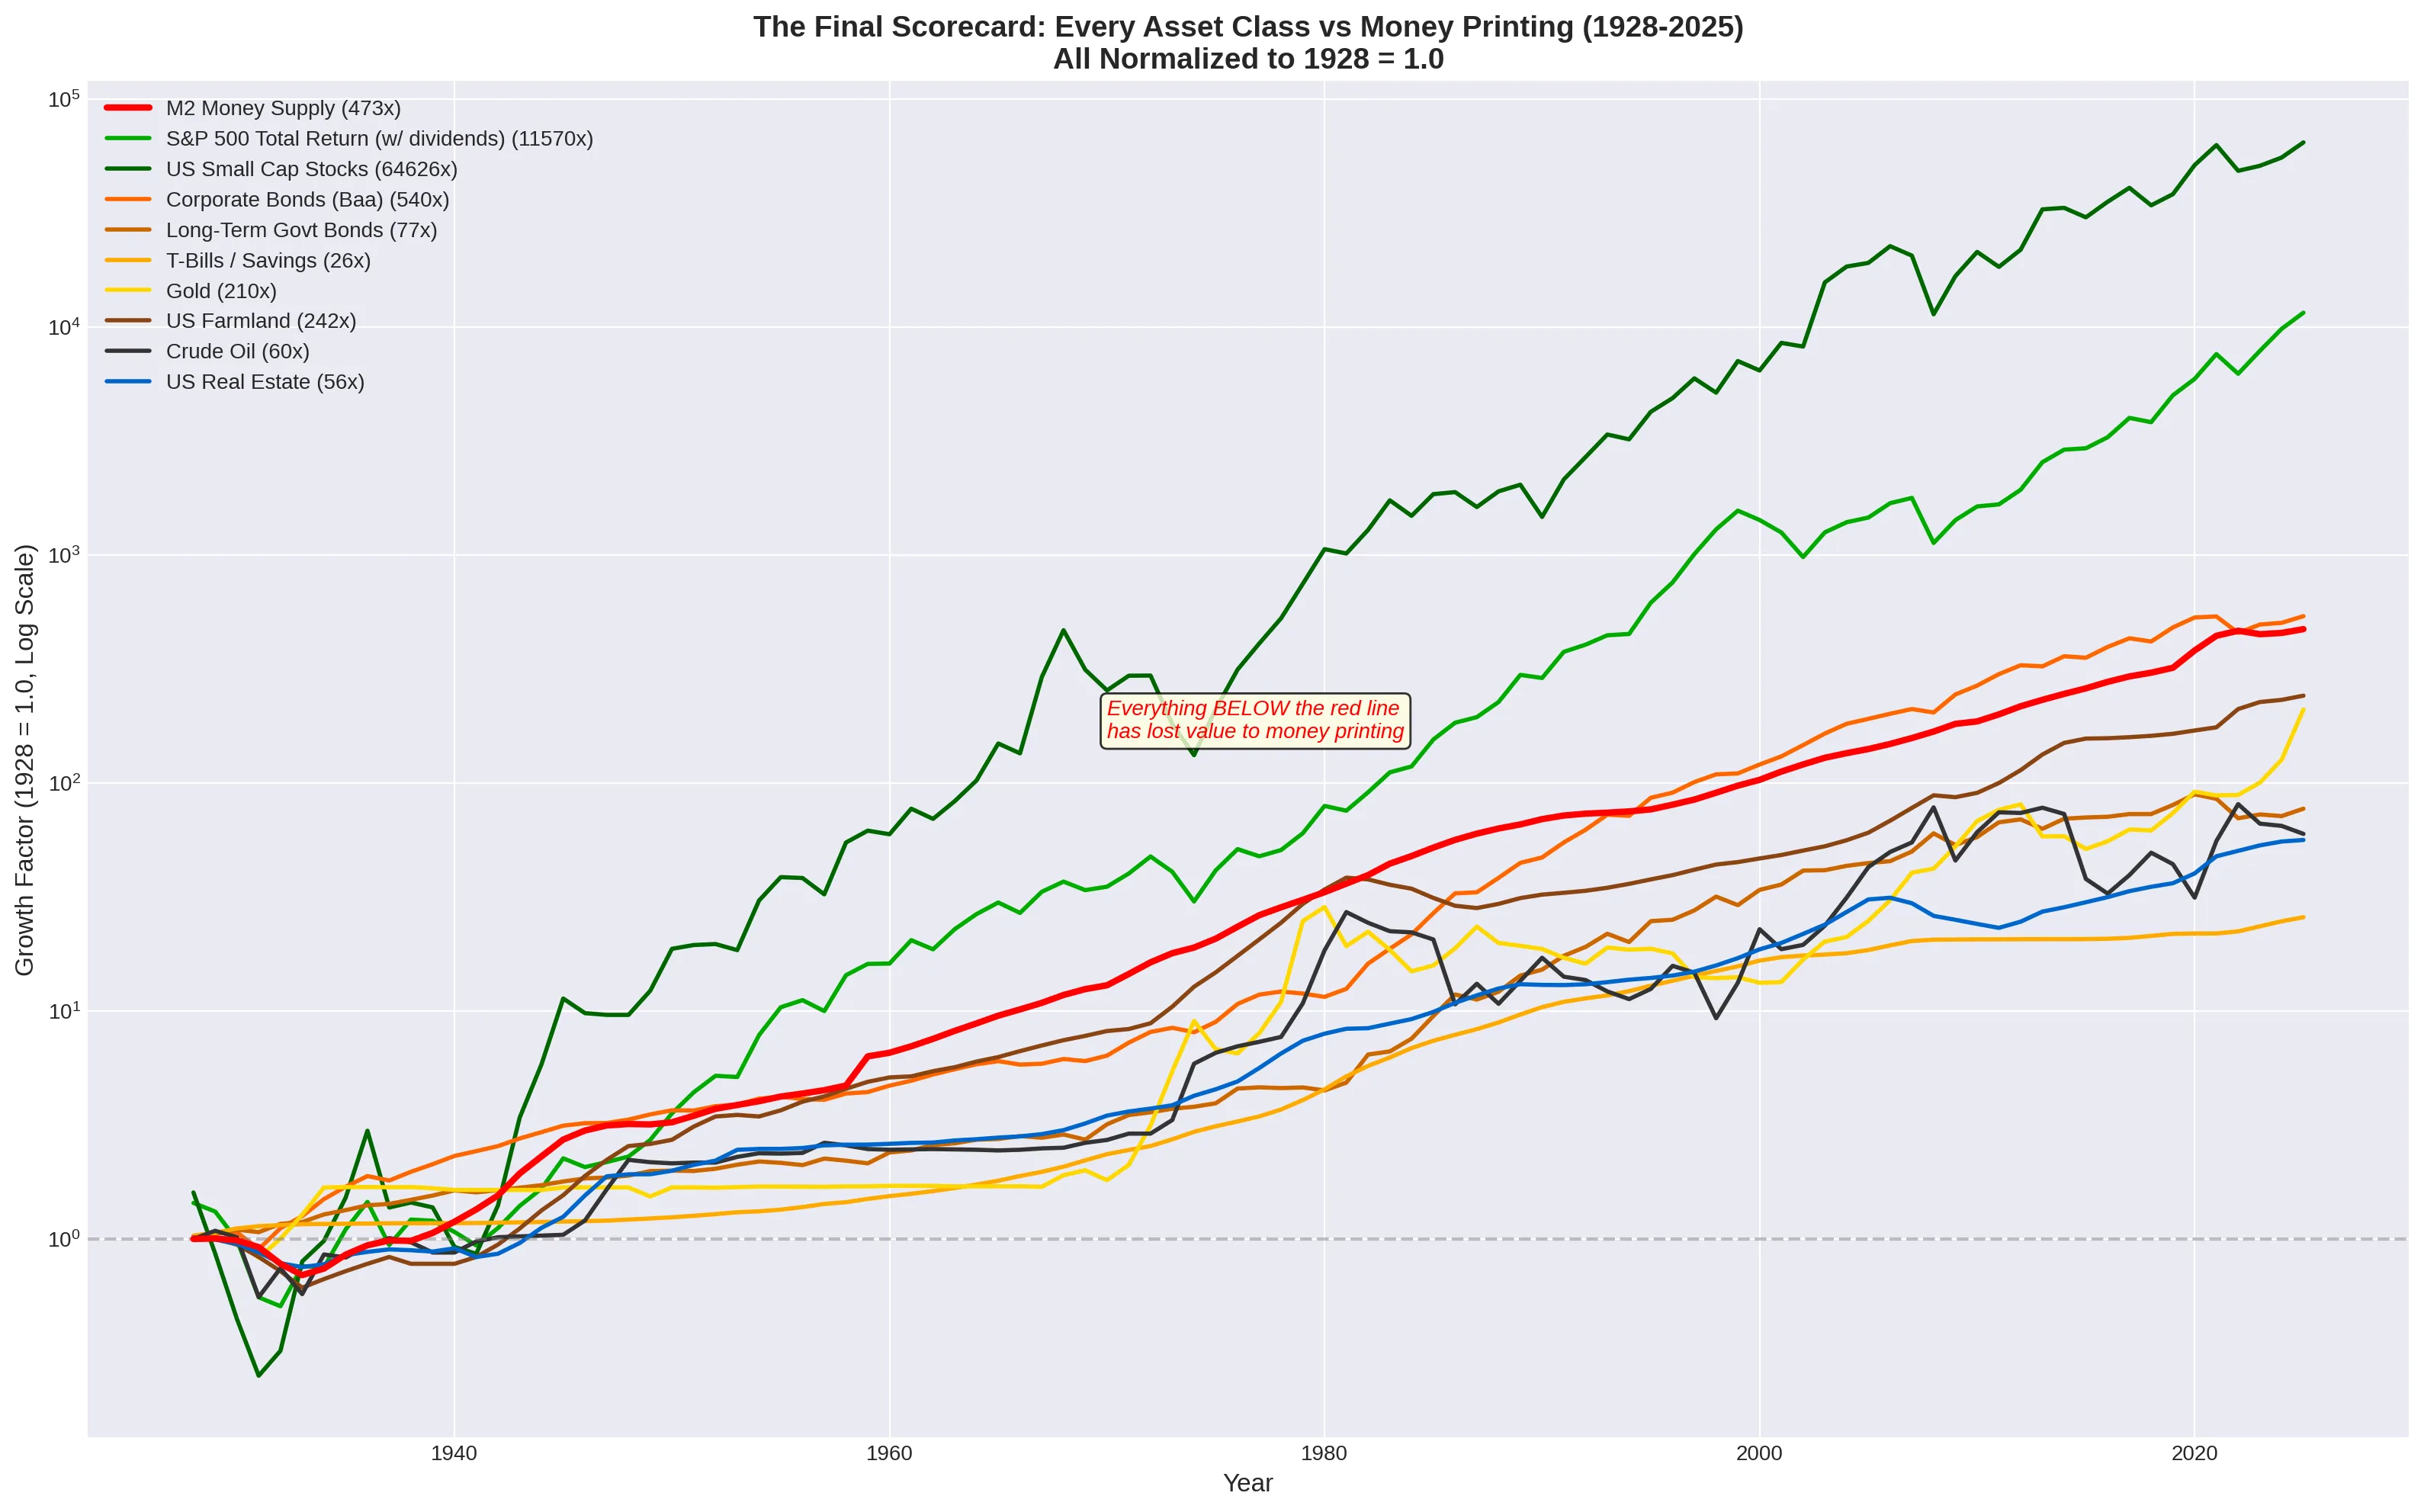
When viewed on a logarithmic scale, the vast majority of asset classes cluster tightly together, slowly losing ground to the red line of money supply expansion.
The Losers: Real Assets and Debt
The traditional pillars of wealth preservation, real estate, commodities, and government debt, all failed the test of monetary dilution.
- US Farmland: Often cited as the ultimate store of value, farmland prices grew 242x nominally since 1928 [4]. Yet this is only roughly half the rate of money printing.
- Crude Oil: Despite the geopolitical shocks of the 1970s and the massive increase in global demand, the price of crude oil grew only 60x nominally [5].
- Long-Term Government Bonds: Backed by the US Treasury, long-term bonds grew 77x [1]. Whilst safer than cash, they still lost over 80% of their value relative to M2.
- Gold and Real Estate: As established in earlier sections, neither gold (210x) nor housing (56x) kept pace with the 473x expansion of the currency [1] [2].
The Winners: Equities (But Only With Dividends)
The only assets to break above the red line of money printing were equities, specifically the S&P 500 Total Return and US Small Cap Stocks.
There is, however, a massive caveat to the S&P 500’s victory.
The Dividend Difference
In Part II, we noted that the nominal price of the S&P 500 grew 308x, failing to beat the 473x M2 expansion. How, then, did the S&P 500 become a “winner” in Part III?
The answer is dividends.
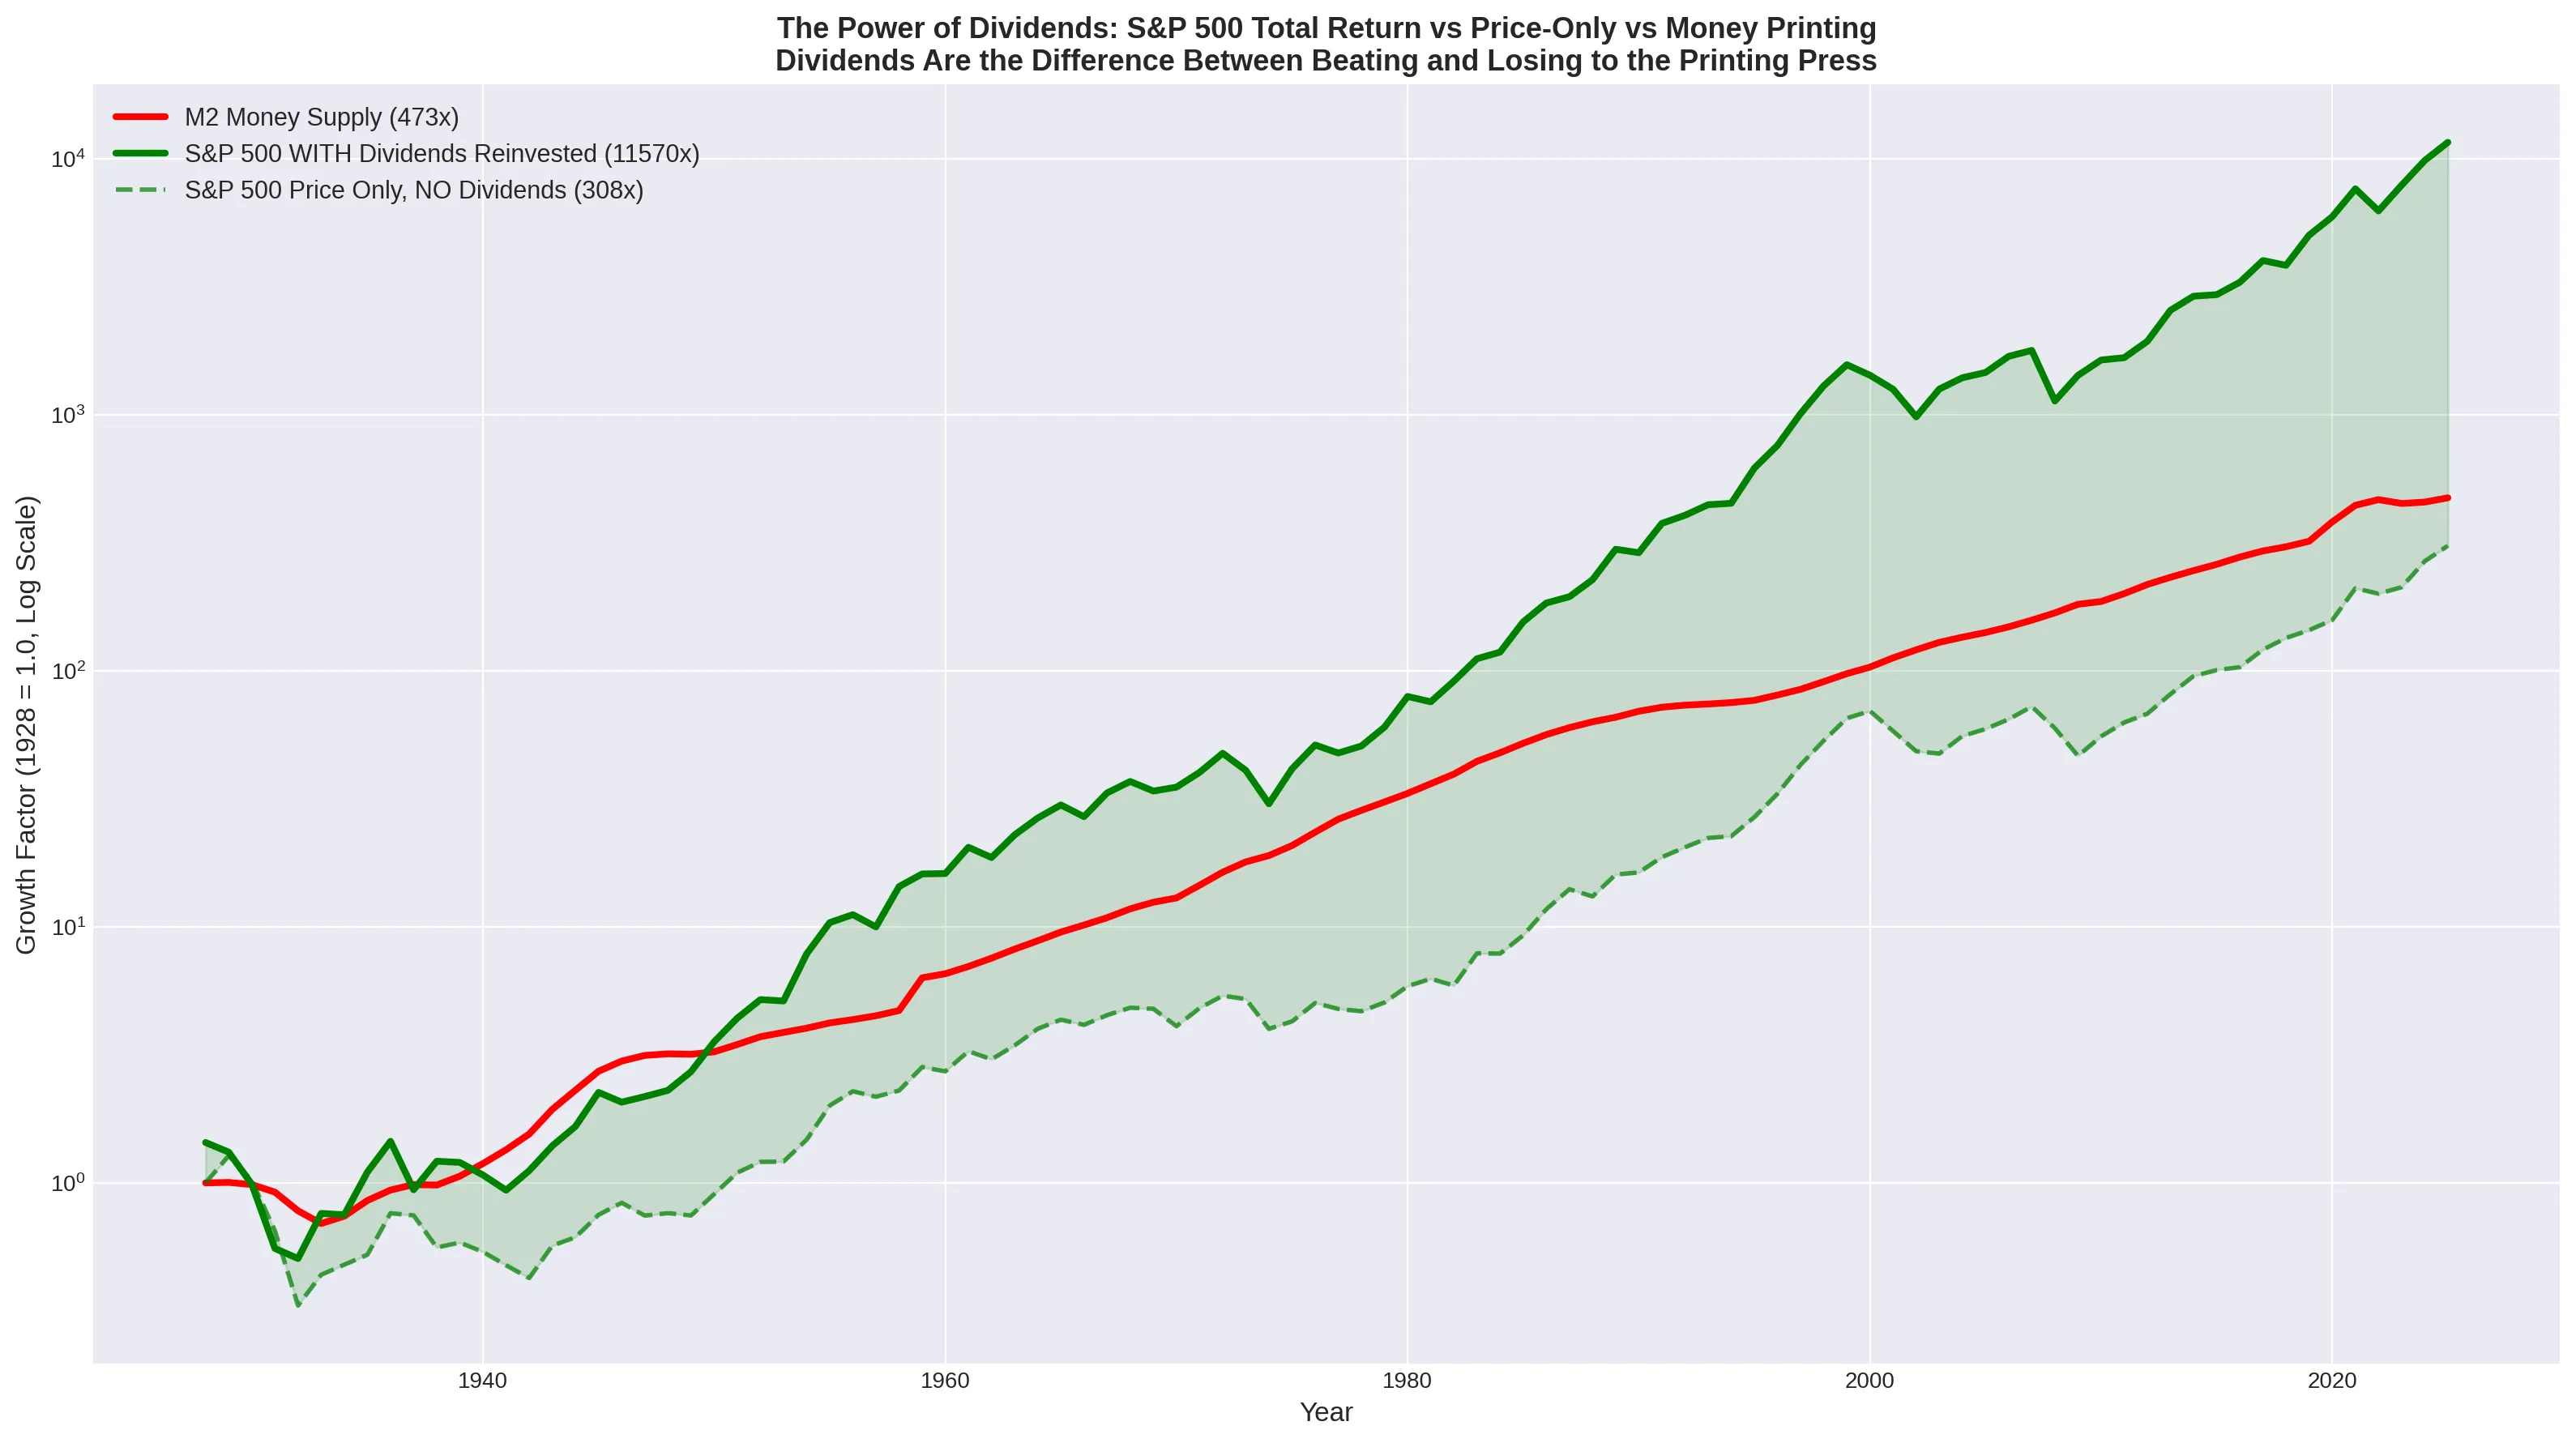
If an investor bought the S&P 500 in 1928 and spent the dividends as income, their capital lost value relative to the money supply. But if that investor ruthlessly reinvested every single dividend back into the index, the compounding effect was dramatic.
The S&P 500 Total Return index grew a remarkable 11,570x, massively outpacing money printing. US Small Cap stocks, which carry higher risk, performed even better, growing 64,626x [1].
This reveals a hard truth about 20th-century investing: The stock market only beat inflation if you never took any money out of it. The moment you spent your yield, you fell behind the printing press.
The Final Verdict
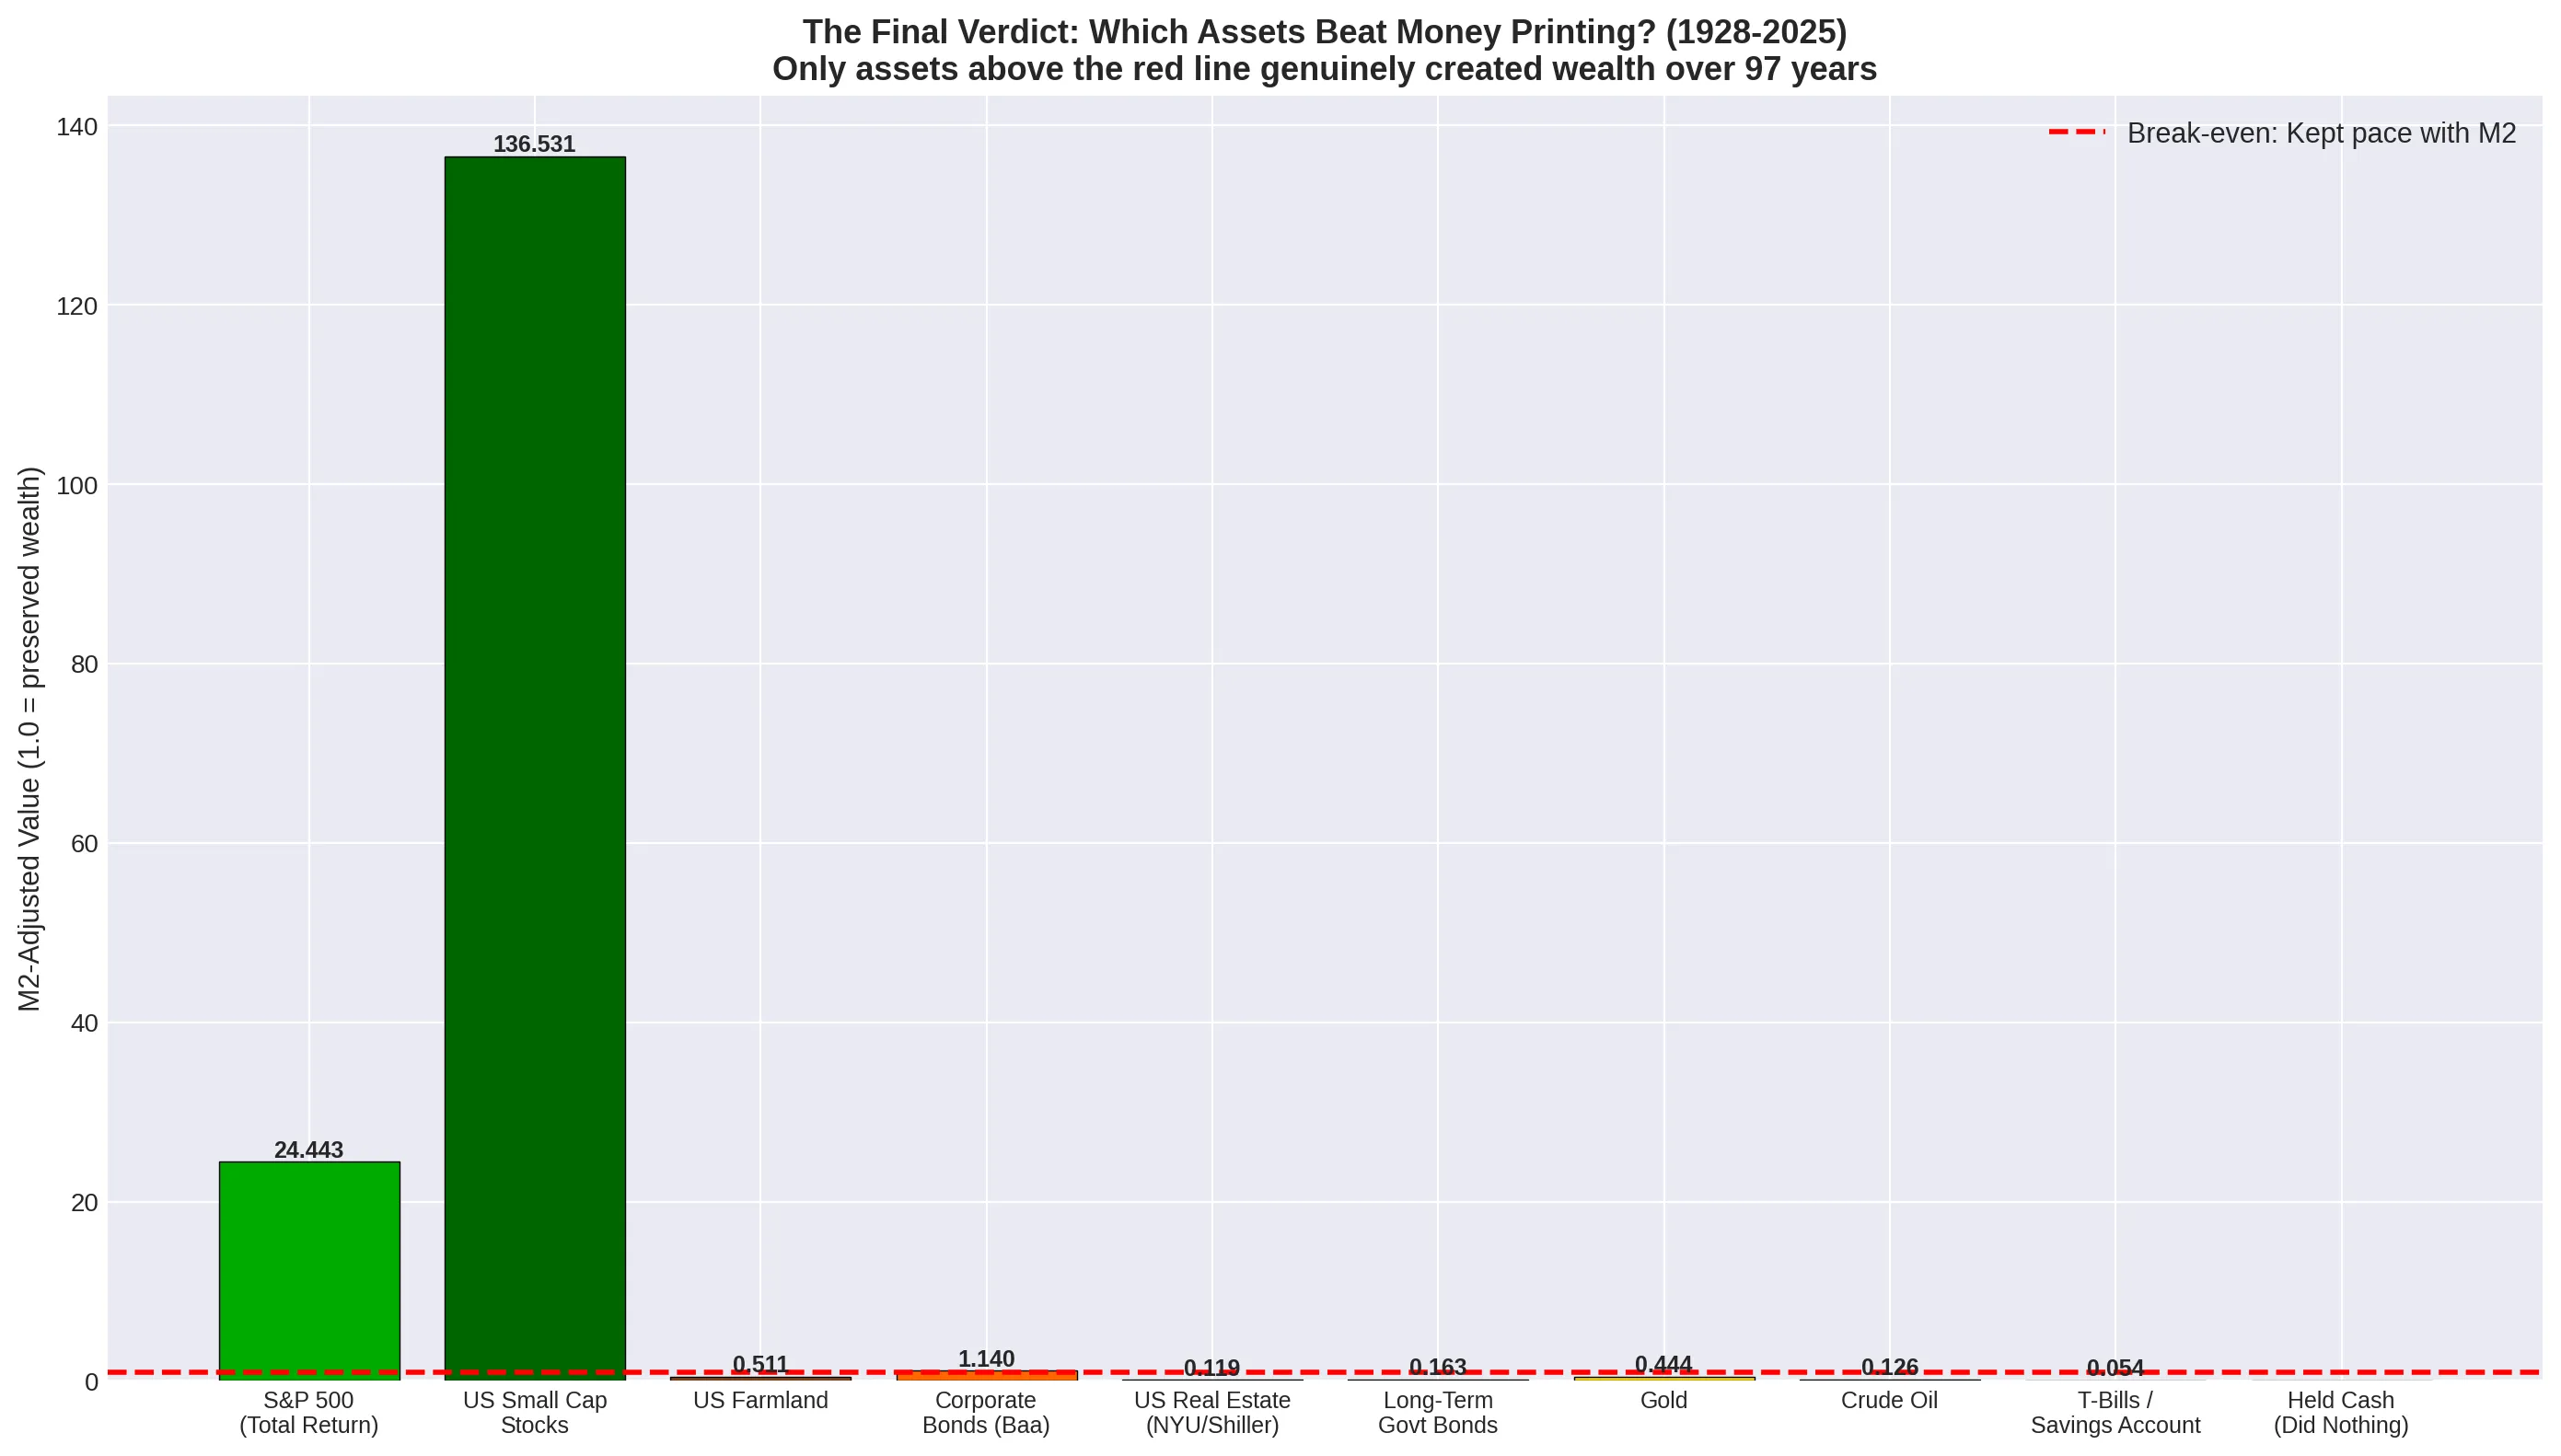
When we adjust every asset for the 473x expansion of the M2 money supply, the true hierarchy of wealth creation becomes visible. An M2-adjusted value of 1.0 means the asset exactly maintained its relative purchasing power.
| Asset | Nominal Growth | M2-Adjusted | Verdict |
|---|---|---|---|
| M2 Money Supply | 473.3x | 1.000 | BASELINE |
| US Small Cap Stocks | 64,626.0x | 136.531 | BEAT M2 |
| S&P 500 (Total Return) | 11,570.1x | 24.443 | BEAT M2 |
| Corporate Bonds (Baa) | 539.5x | 1.140 | BEAT M2 (barely) |
| US Farmland | 241.7x | 0.511 | LOST |
| Gold | 210.3x | 0.444 | LOST |
| Long-Term Govt Bonds | 77.2x | 0.163 | LOST |
| Crude Oil | 59.8x | 0.126 | LOST |
| US Real Estate (NYU) | 56.3x | 0.119 | LOST |
| T-Bills (Savings) | 25.8x | 0.055 | LOST MASSIVELY |
Only three asset classes survived the century. Corporate bonds barely scraped by, offering a meagre 14% real gain over 97 years. Only total-return equities genuinely built wealth.
The Hurdle Rate
Why was it so hard to win? Because the “hurdle rate”, the annual return required just to break even with money printing, was consistently higher than traditional safe yields.
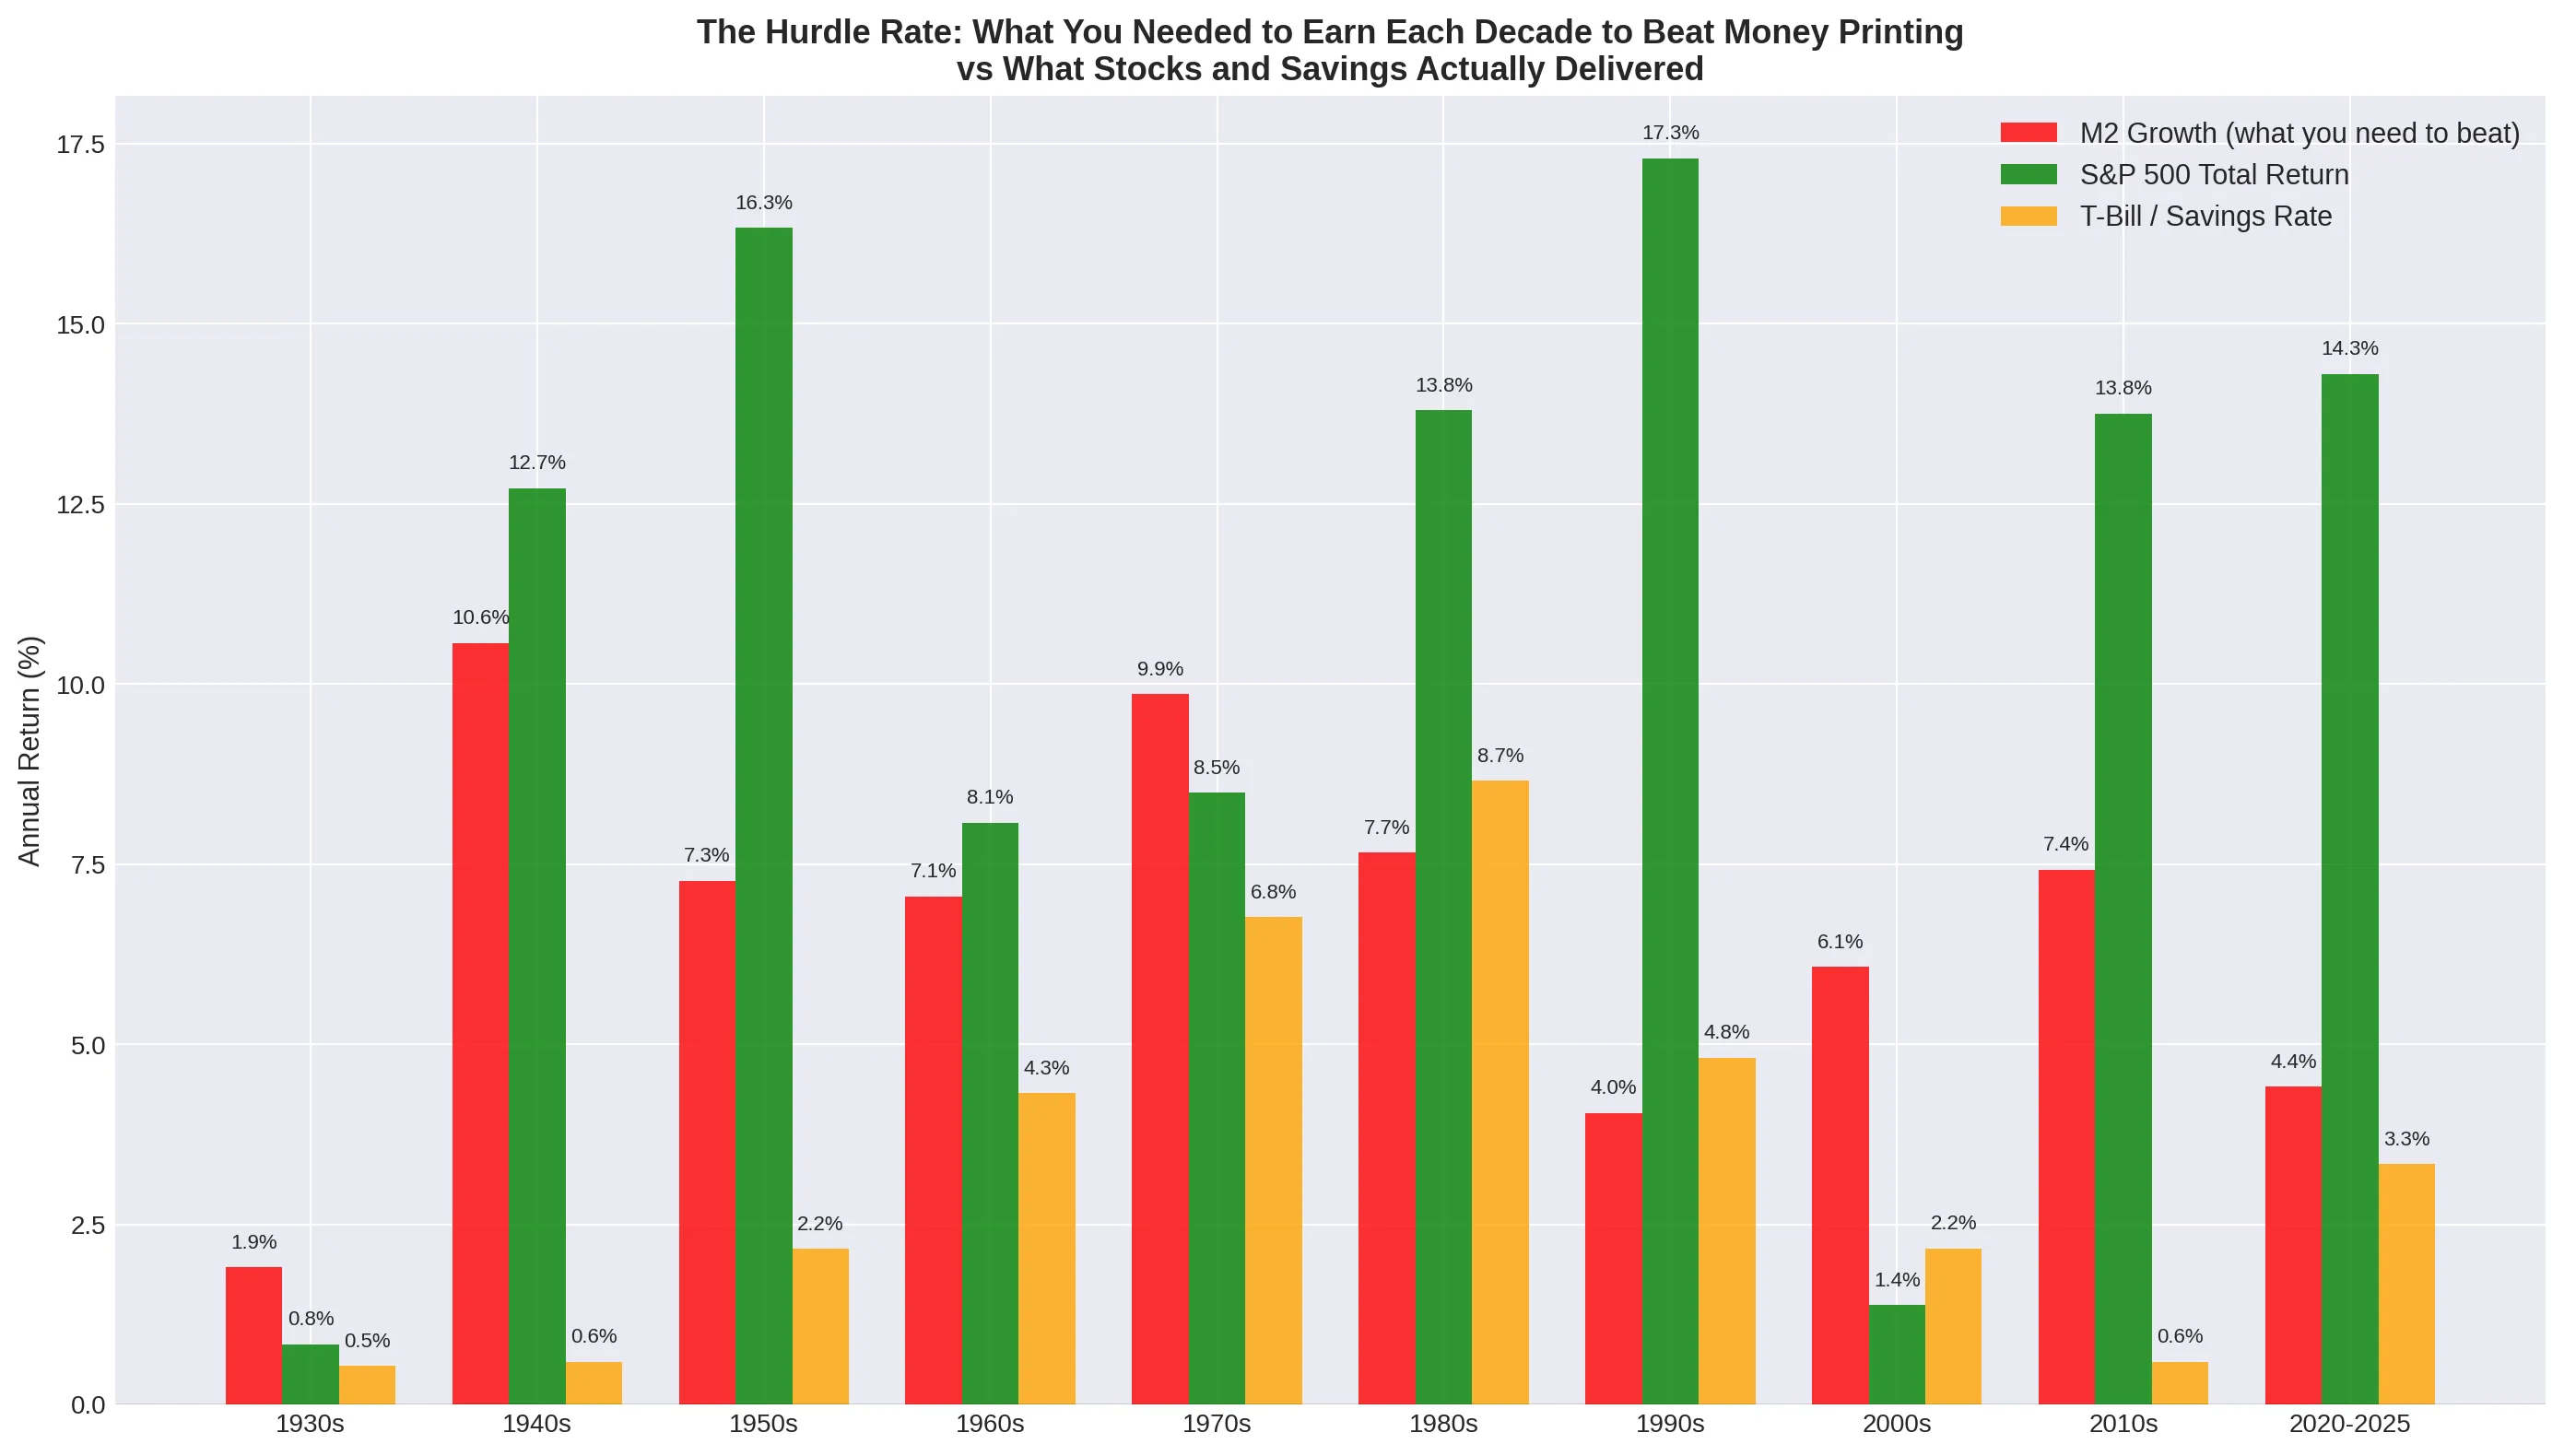
In almost every decade, the rate of M2 growth (the red bar) exceeded the rate of safe savings (the yellow bar). In extreme decades like the 1940s and 1970s, money printing approached 10% annually, destroying anyone holding cash or bonds.
Conclusion: The Setup for the Digital Age
For 100 years, the investor’s dilemma has been brutal: accept the slow confiscation of wealth through “safe” assets, or take on equity risk and lock up your capital, reinvesting every dividend, just to stay ahead of the central banks.
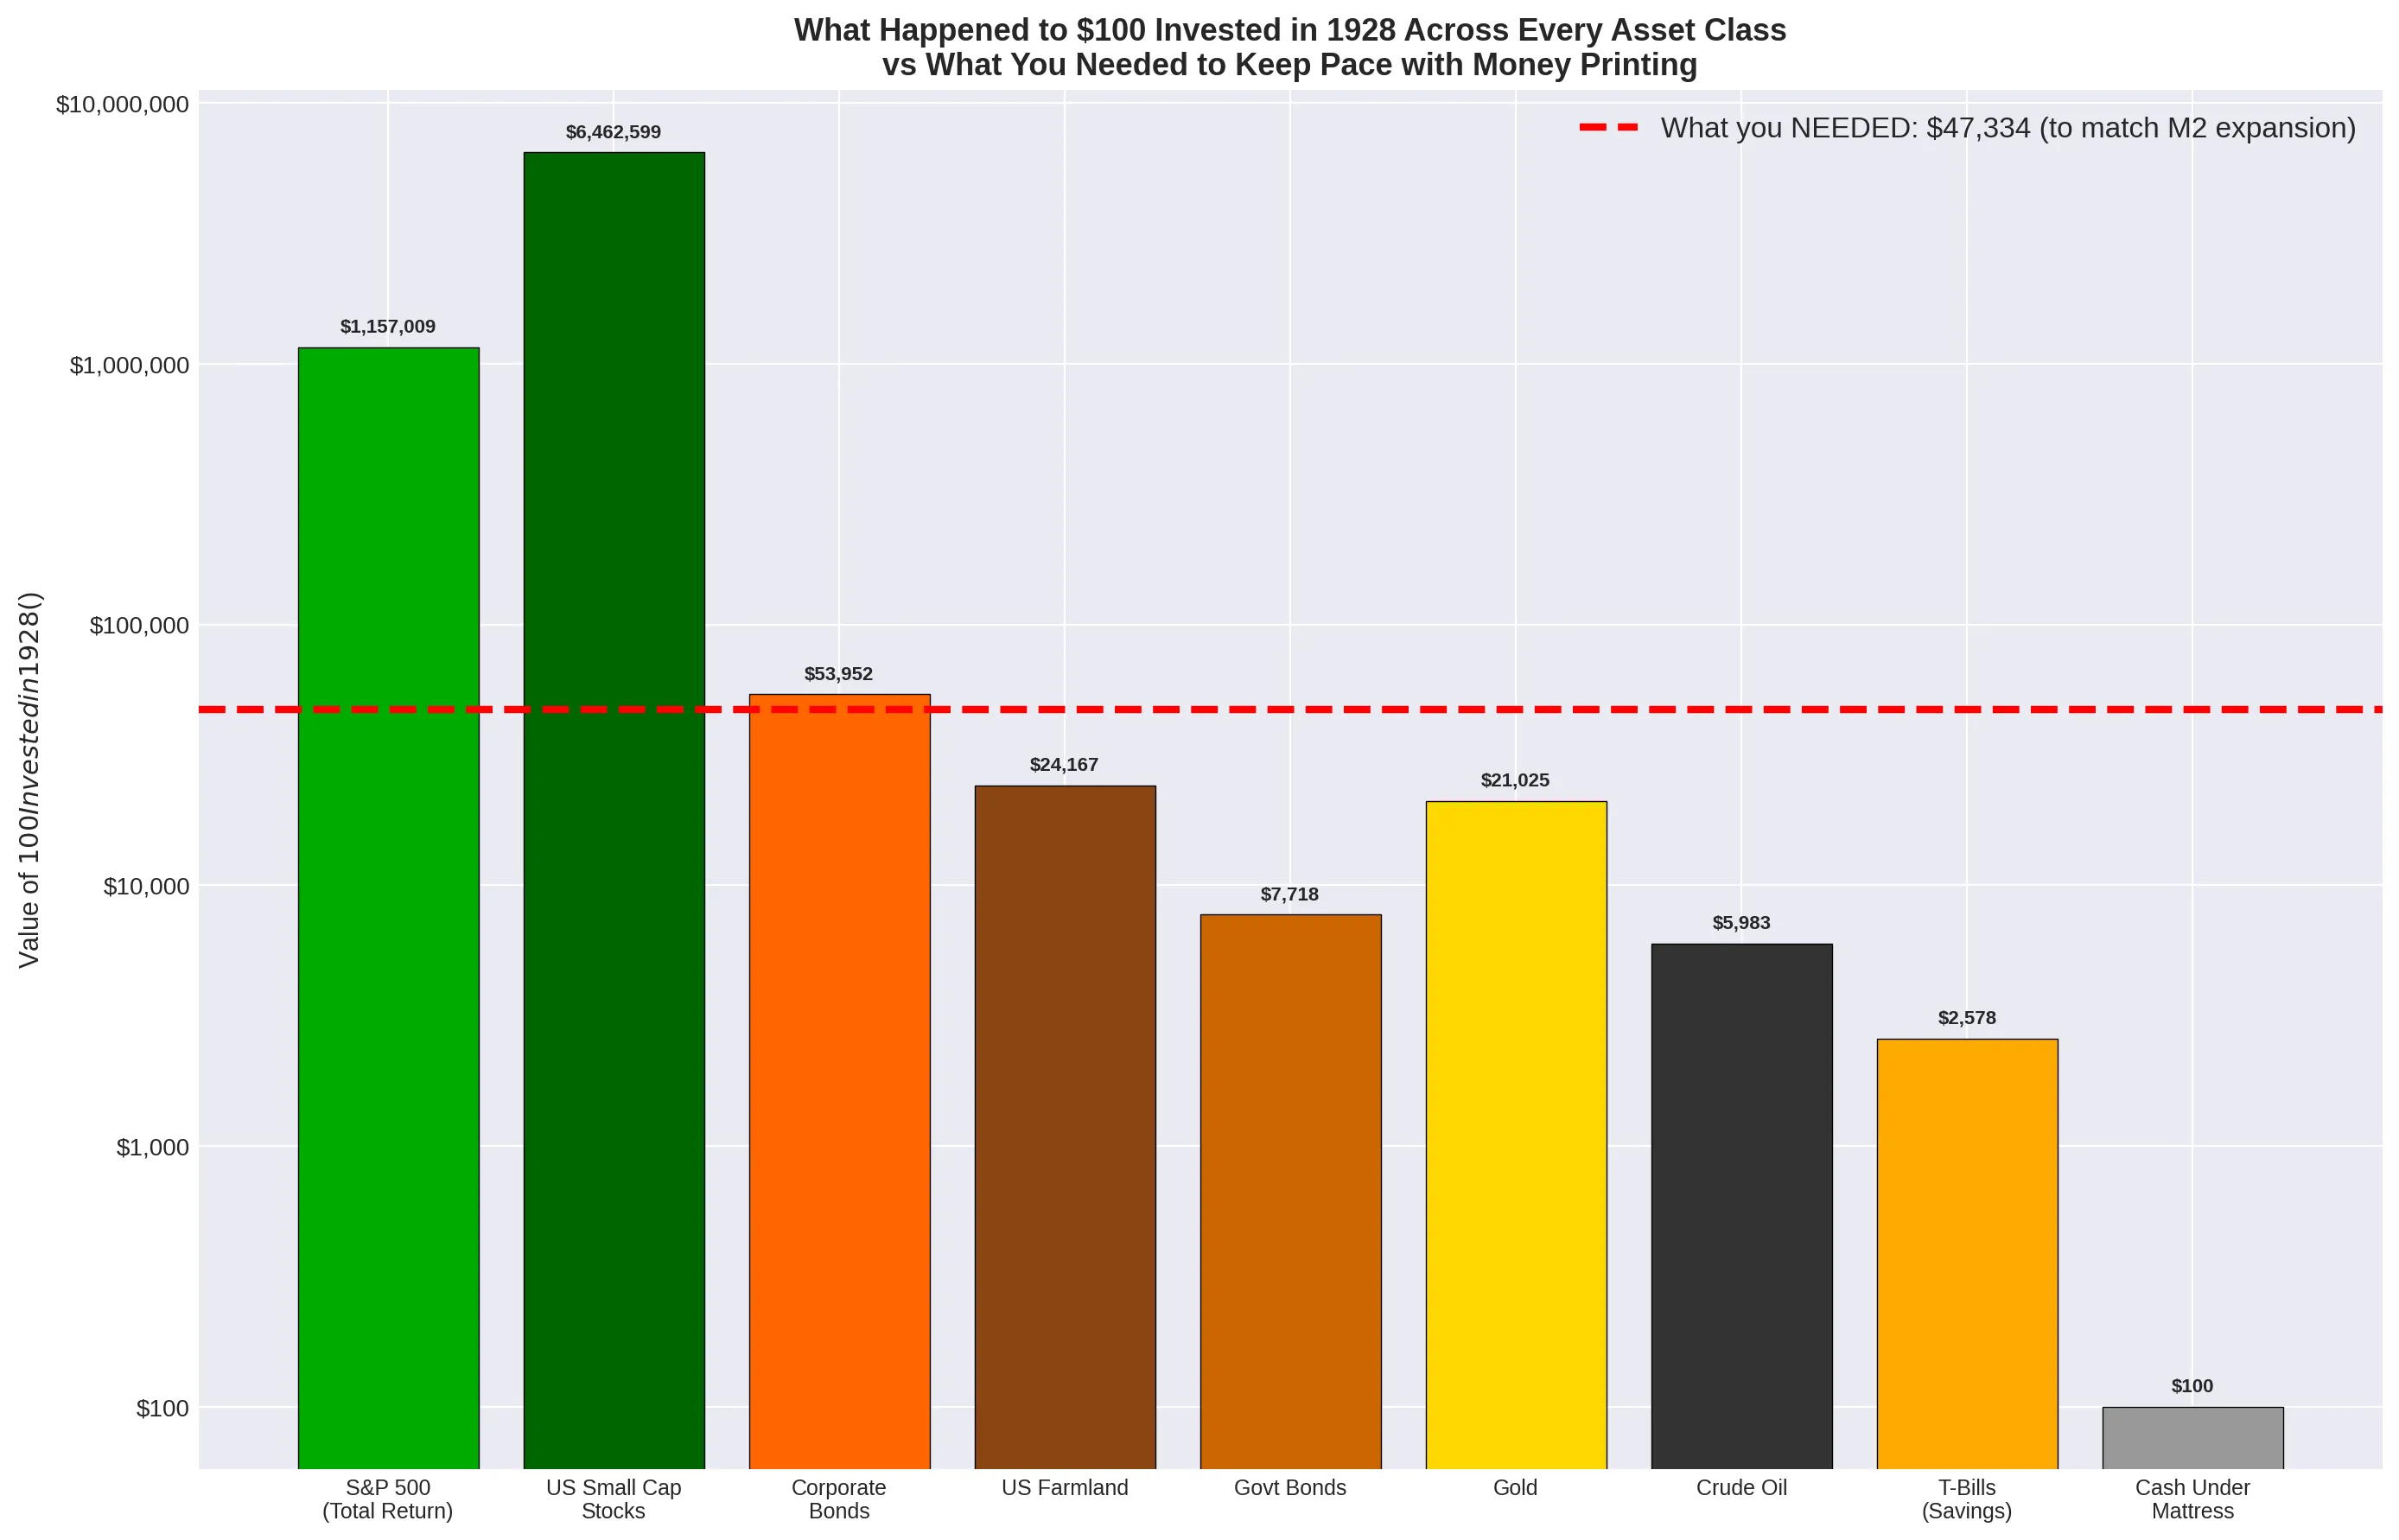
If you invested $100 in 1928, you needed it to become $47,300 today just to maintain your slice of the monetary pie. As the chart above shows, most traditional strategies failed this basic test.
But what happens when we look at the modern era?
In the last 20 to 50 years, the rate of money printing has accelerated dramatically. Have the traditional winners (equities) been able to keep up with this new pace? And more importantly, has the digital age, through the Nasdaq tech boom or the invention of Bitcoin, finally provided an asset class capable of outrunning the printing press without requiring a century of locked-up dividend reinvestment?
That is the question we will answer in Part IV: The Digital Shift (1971–2025).
References
[1] Damodaran, Aswath. “Historical Returns on Stocks, Bonds and Bills: 1928-2025.” NYU Stern School of Business. [2] Federal Reserve Economic Data (FRED). “M2 Money Supply (M2SL).” Federal Reserve Bank of St. Louis. [3] Macrotrends. “S&P 500 Historical Annual Returns.” [4] United States Department of Agriculture (USDA). “Land Values 2025 Summary.” National Agricultural Statistics Service. [5] U.S. Energy Information Administration (EIA). “U.S. Crude Oil First Purchase Price.”