The Illusion of Wealth (Part V)
Crypto vs Stocks: Bitcoin & Tech in the Digital Era
This is Part V of the "Illusion of Wealth" series tracking 100 years of dollar value dilution.
Table of Contents
Has the advent of the PC, the Internet, and Cryptocurrency finally provided an escape velocity from the printing press?
Executive Summary
Over the first four parts of this series, a clear pattern emerged: for most of the 20th century, the expansion of the US money supply (M2) systematically diluted the purchasing power of almost every traditional asset class. Only by locking capital into equities and reinvesting 100% of the yield for decades, or by outsourcing capital allocation to Warren Buffett, could an investor genuinely outpace the printing press.
But when we view a 100-year chart, the last 50 years appear flattened. This visual distortion masks the most significant economic shift in modern history: the digital revolution.
In Part V, we zoom in on the modern era (1980-2026) to test a new hypothesis. Did the invention of the microchip, the internet, and decentralised digital scarcity (Bitcoin) fundamentally change the rules of wealth creation? Did these technologies allow investors to achieve in 15 to 30 years what previously took 60 years?
The data reveals that the digital era did indeed break the old paradigm. Whilst the Nasdaq and mega-cap tech stocks offered unprecedented M2-adjusted returns, Bitcoin emerged as the single most effective monetary hedge in recorded financial history, driven by the mathematical certainty of its fixed supply against infinite fiat expansion.
The Three Eras of Investing
To understand the magnitude of the digital shift, we must first un-flatten the historical record. By dividing the last 65 years into three distinct eras and resetting the baseline to 1.0 at the start of each period, we can see exactly which assets dominated their respective epochs.
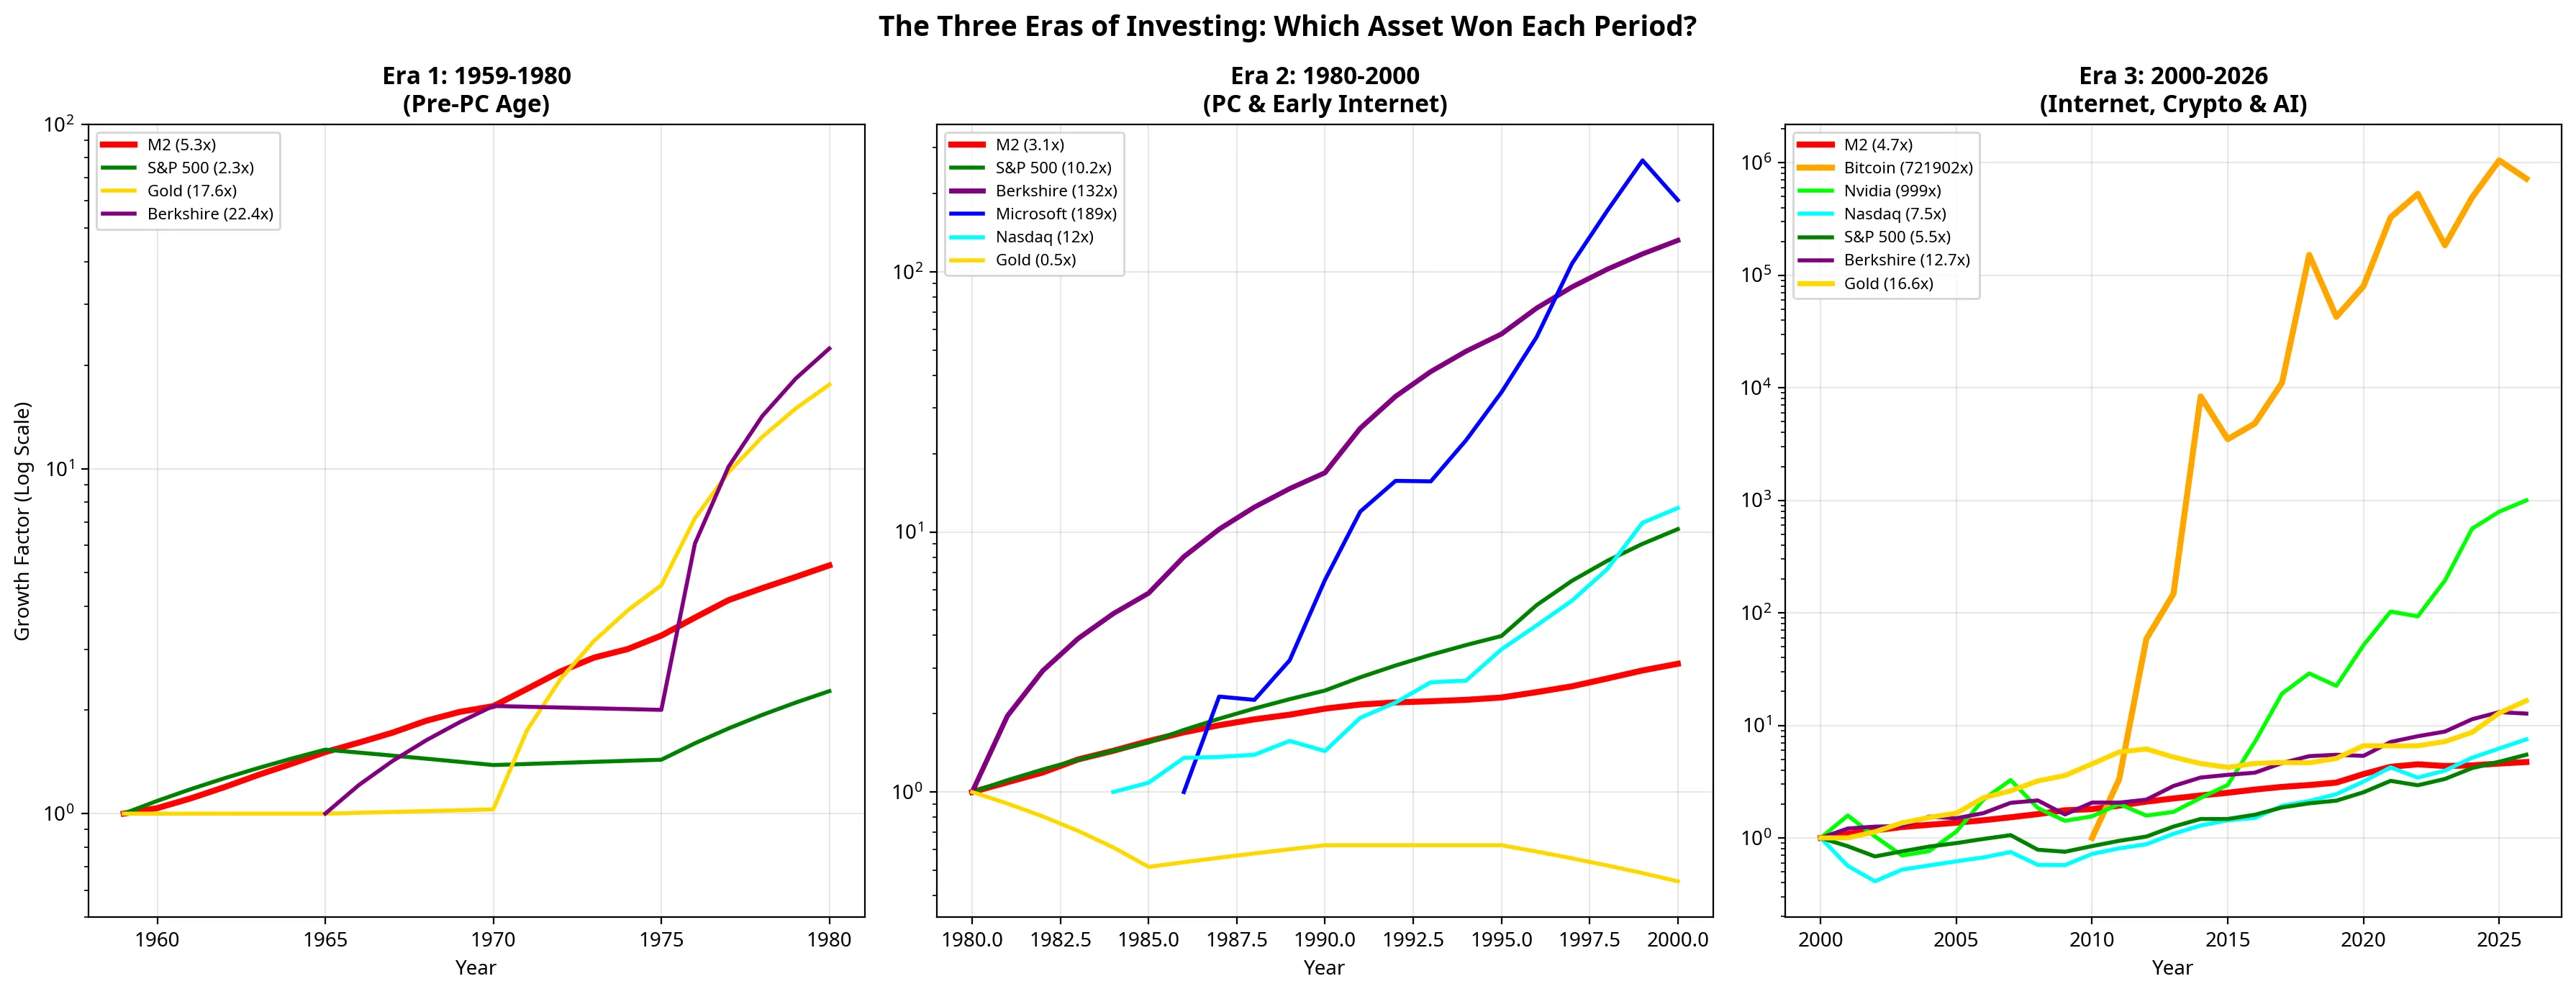
Era 1: The Pre-PC Age (1959-1980)
During the stagflation and geopolitical turmoil of the 1960s and 1970s, the M2 money supply expanded by 5.3x. The S&P 500 failed to keep pace. The undisputed winner of this era was Gold, which grew 17.6x after the US abandoned the gold standard in 1971 [1].
Era 2: PC & Early Internet (1980-2000)
As the microchip entered the mainstream, the monetary expansion slowed slightly to 3.1x. This was the golden age of traditional equities. Berkshire Hathaway dominated the period, growing 132x. However, the seeds of the next era were planted here: Microsoft, riding the software revolution, grew 189x from its 1986 IPO to the year 2000 [2].
Era 3: Internet, Crypto & AI (2000-2026)
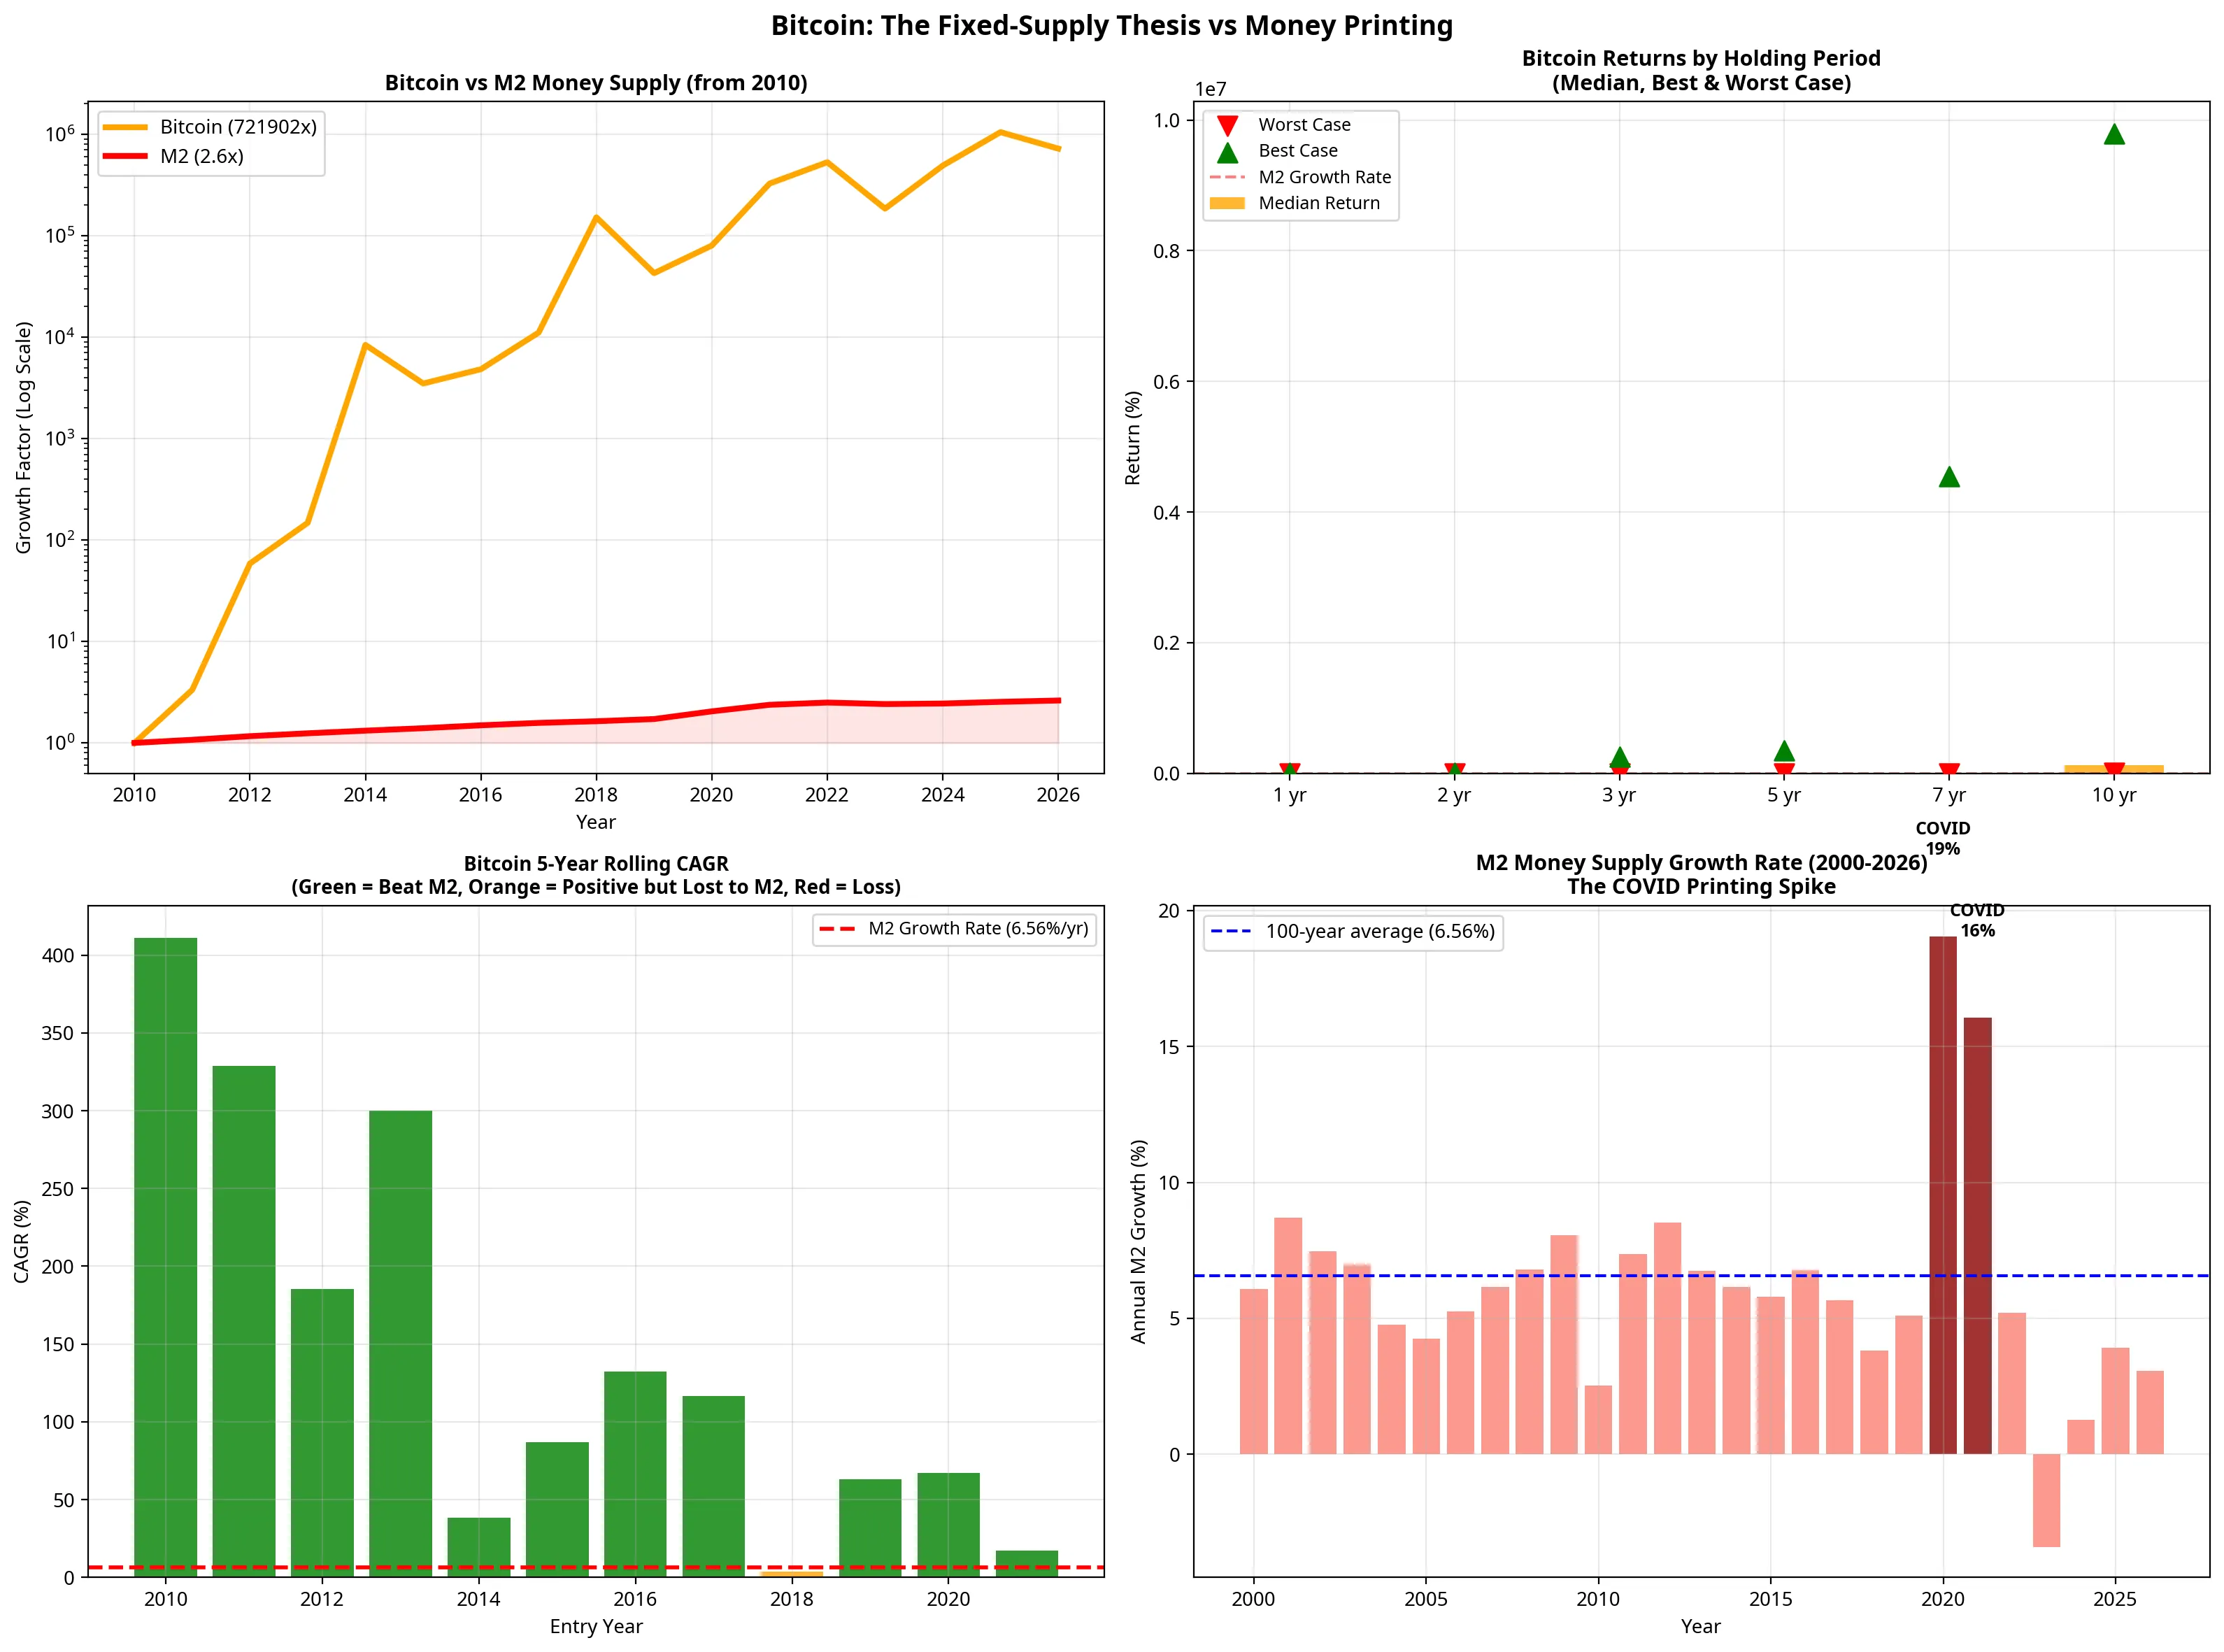
In the modern era, central banks accelerated money printing dramatically, expanding M2 by 4.7x in just 26 years [3]. Traditional assets like Gold and the S&P 500 barely kept their heads above water. The era belonged entirely to digital assets. Nvidia grew nearly 1,000x from 1999, driven by gaming and eventually AI. It was dwarfed, however, by Bitcoin, which grew an extraordinary 721,902x from its early recorded pricing in 2010 [4].
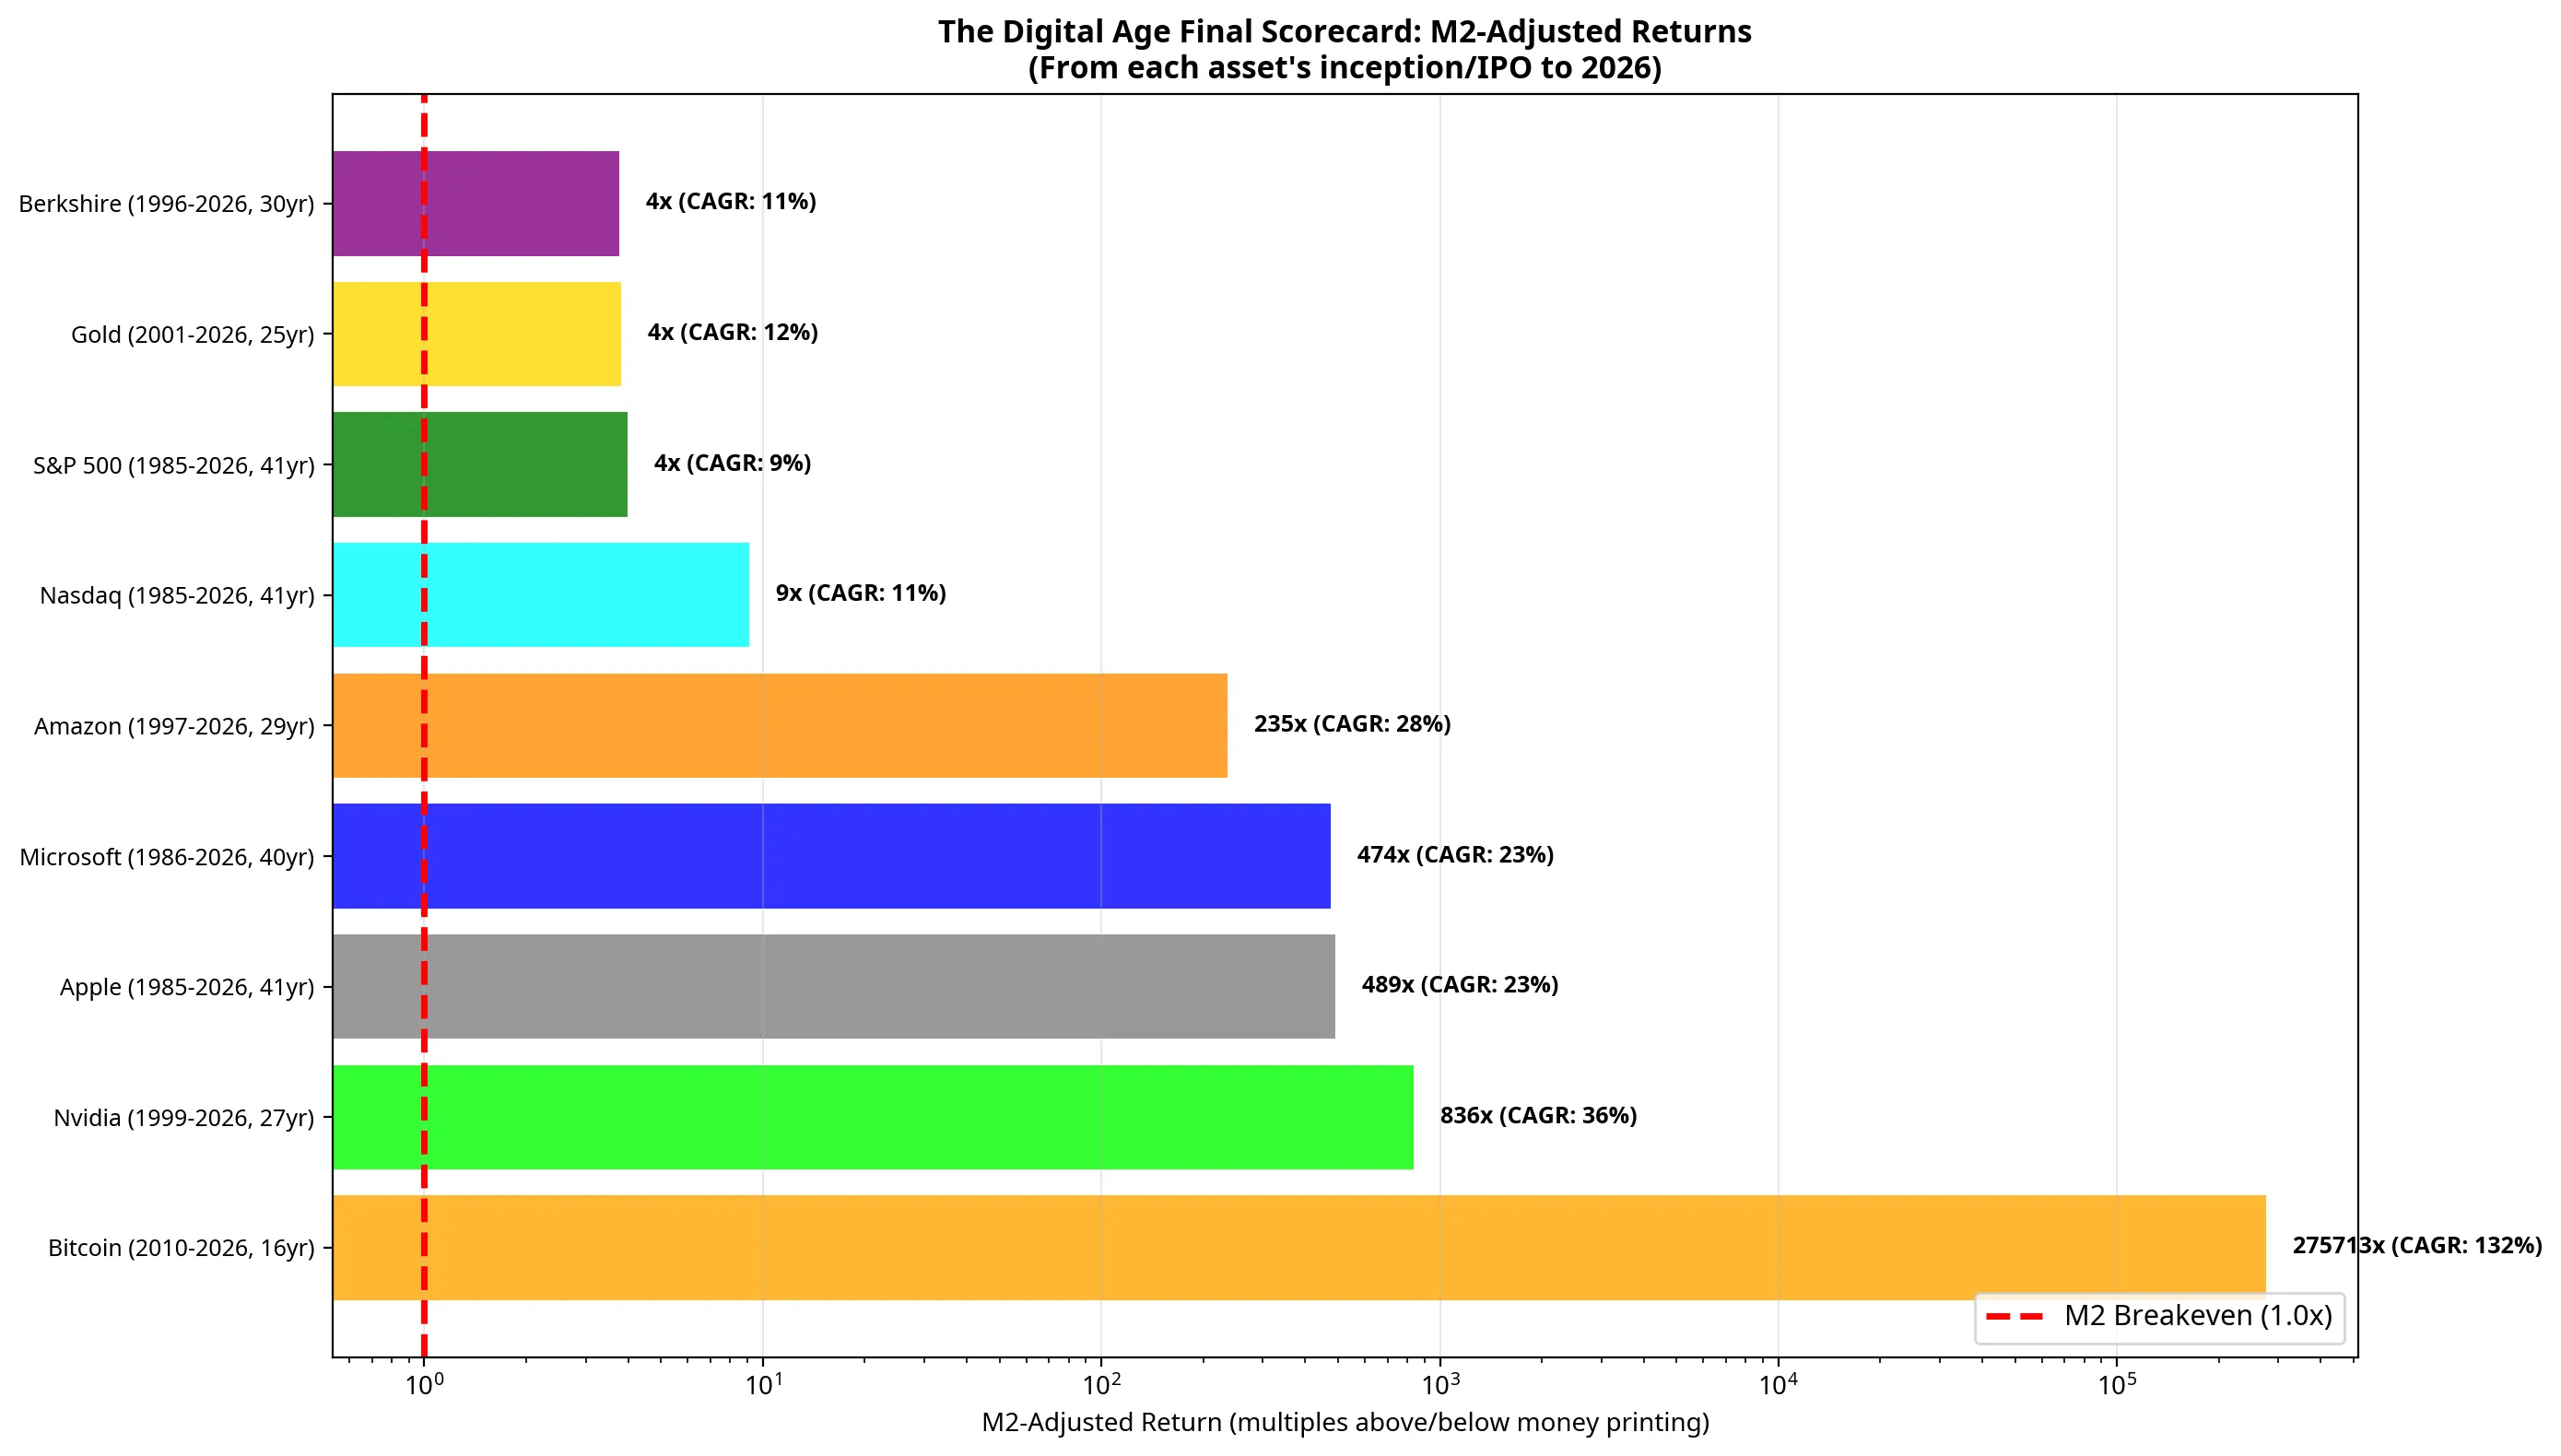
The Tech IPOs vs. The Printing Press
In Part IV, we saw that generational “old economy” winners like Walmart and Home Depot achieved M2-adjusted returns of roughly 800x to 1,000x over 40 to 55 years.
Did the tech giants of the digital age beat this record?
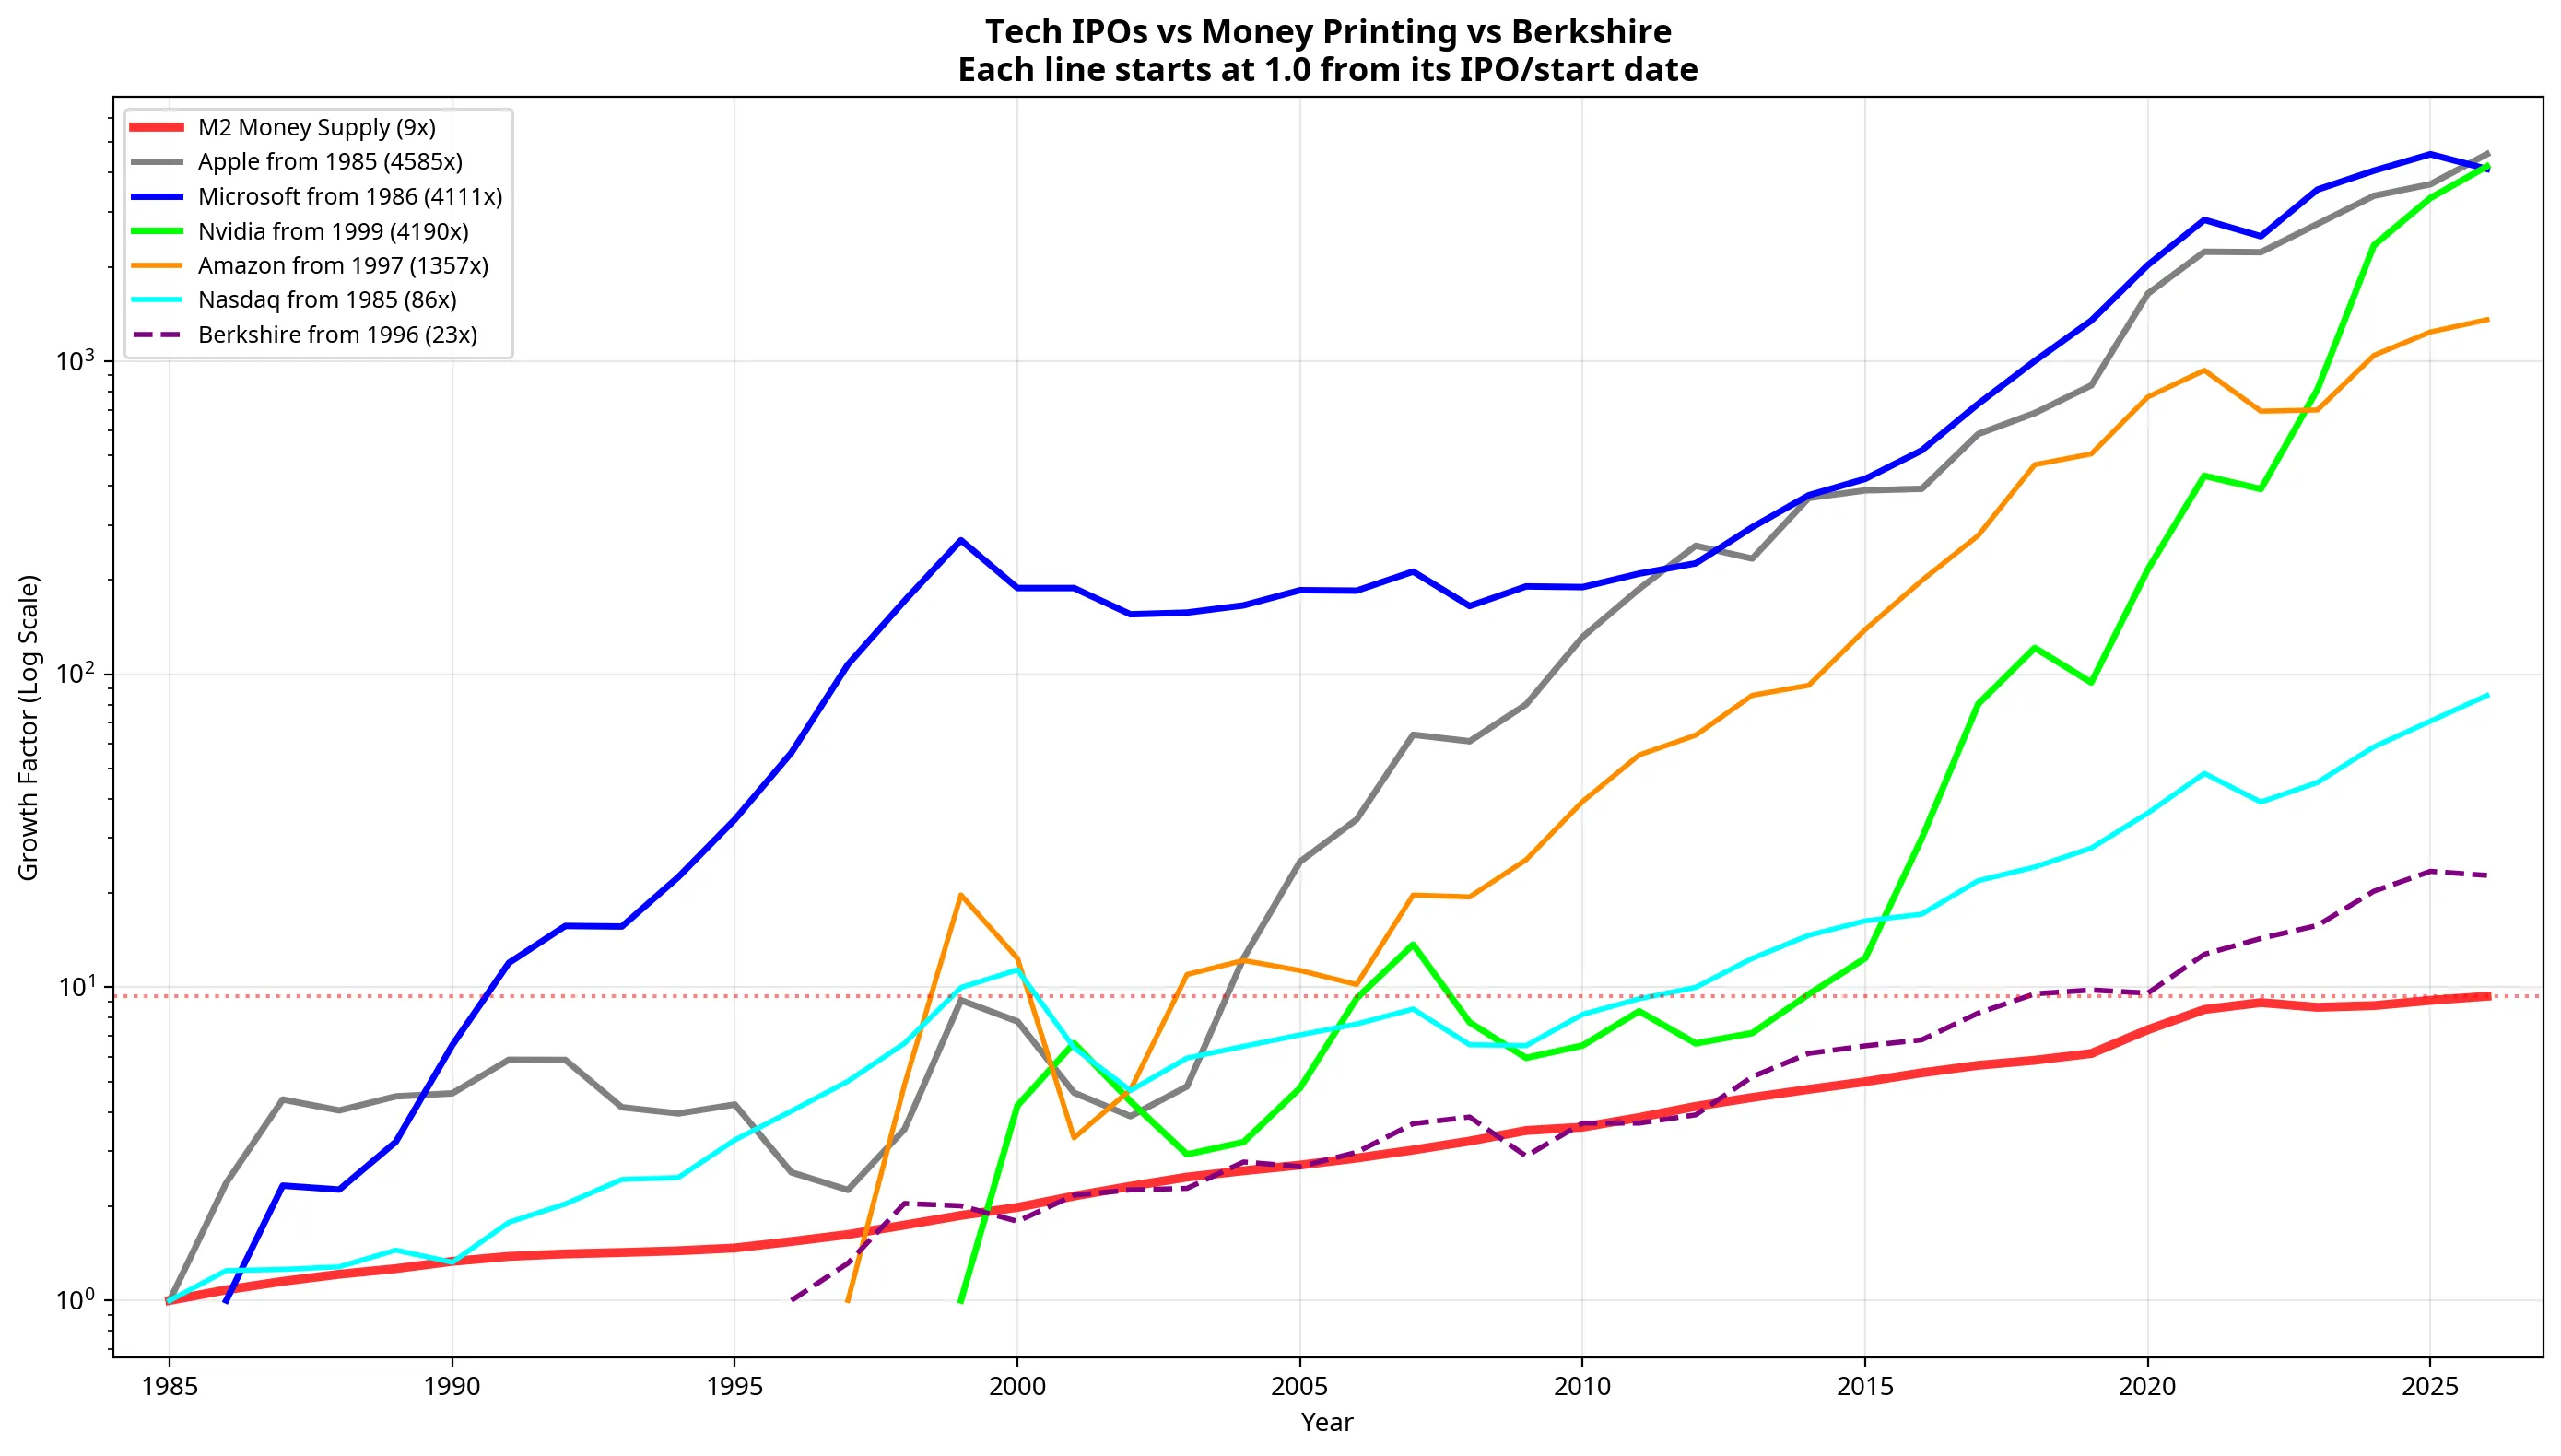
When we measure the mega-cap tech stocks from their respective IPOs against the expansion of the money supply, we see unprecedented velocity:
| Asset | IPO/Start | Years | Nominal Growth | M2-Adjusted Return | CAGR |
|---|---|---|---|---|---|
| Nvidia | 1999 | 27 | 4,190x | 836x | 36.2% |
| Apple | 1985 | 41 | 4,585x | 489x | 22.8% |
| Microsoft | 1986 | 40 | 4,111x | 474x | 23.1% |
| Amazon | 1997 | 29 | 1,357x | 235x | 28.2% |
| Nasdaq | 1985 | 41 | 86x | 9x | 11.5% |
Data based on split-adjusted closing prices [2].
Whilst Berkshire Hathaway and Walmart took 55 to 60 years to achieve their ~1,000x M2-adjusted returns, Nvidia achieved an 836x M2-adjusted return in just 27 years. Apple and Microsoft achieved roughly half of Berkshire’s lifetime M2-adjusted return in 15 to 20 fewer years.
The digital revolution did not necessarily raise the ceiling of wealth creation, but it drastically compressed the time required to reach it.
Bitcoin: A Closer Look at Fixed Supply vs. Infinite Fiat
Following the 2008 financial crisis, Bitcoin was created with a specific monetary policy embedded in its code: a hard-capped supply of 21 million coins. The hypothesis was simple. An asset with absolute scarcity must mathematically appreciate against a fiat currency with infinite supply.
Does the data prove this hypothesis?
The Holding Period Reality
Bitcoin is notoriously volatile in the short term. However, when we analyse rolling holding periods, a clear pattern emerges that validates its design as a monetary hedge:
- 1-Year Holds: Highly volatile, with massive gains and frequent steep losses.
- 3-Year Holds: Median returns are strongly positive, but negative outcomes are still possible depending on the entry point.
- 5-Year Holds: As the bottom-left panel of the chart shows, Bitcoin has beaten the M2 expansion rate (6.56%) in 11 out of the 12 possible 5-year rolling windows since 2010. The only 5-year period where it lost to M2 was an entry at the absolute peak of the 2018 bubble, exiting in the 2023 bear market. Even then, the nominal return was positive (4.0% CAGR) [4].
The COVID Question
A critical question for modern investors is whether the massive outperformance of Tech and Crypto in the 2020s was genuine innovation or simply a side effect of unprecedented money printing.
During the COVID-19 response (2020-2021), the US government printed roughly $4.8 trillion, causing the M2 supply to spike at an annualised rate of 19%, nearly triple the 100-year historical average [3].
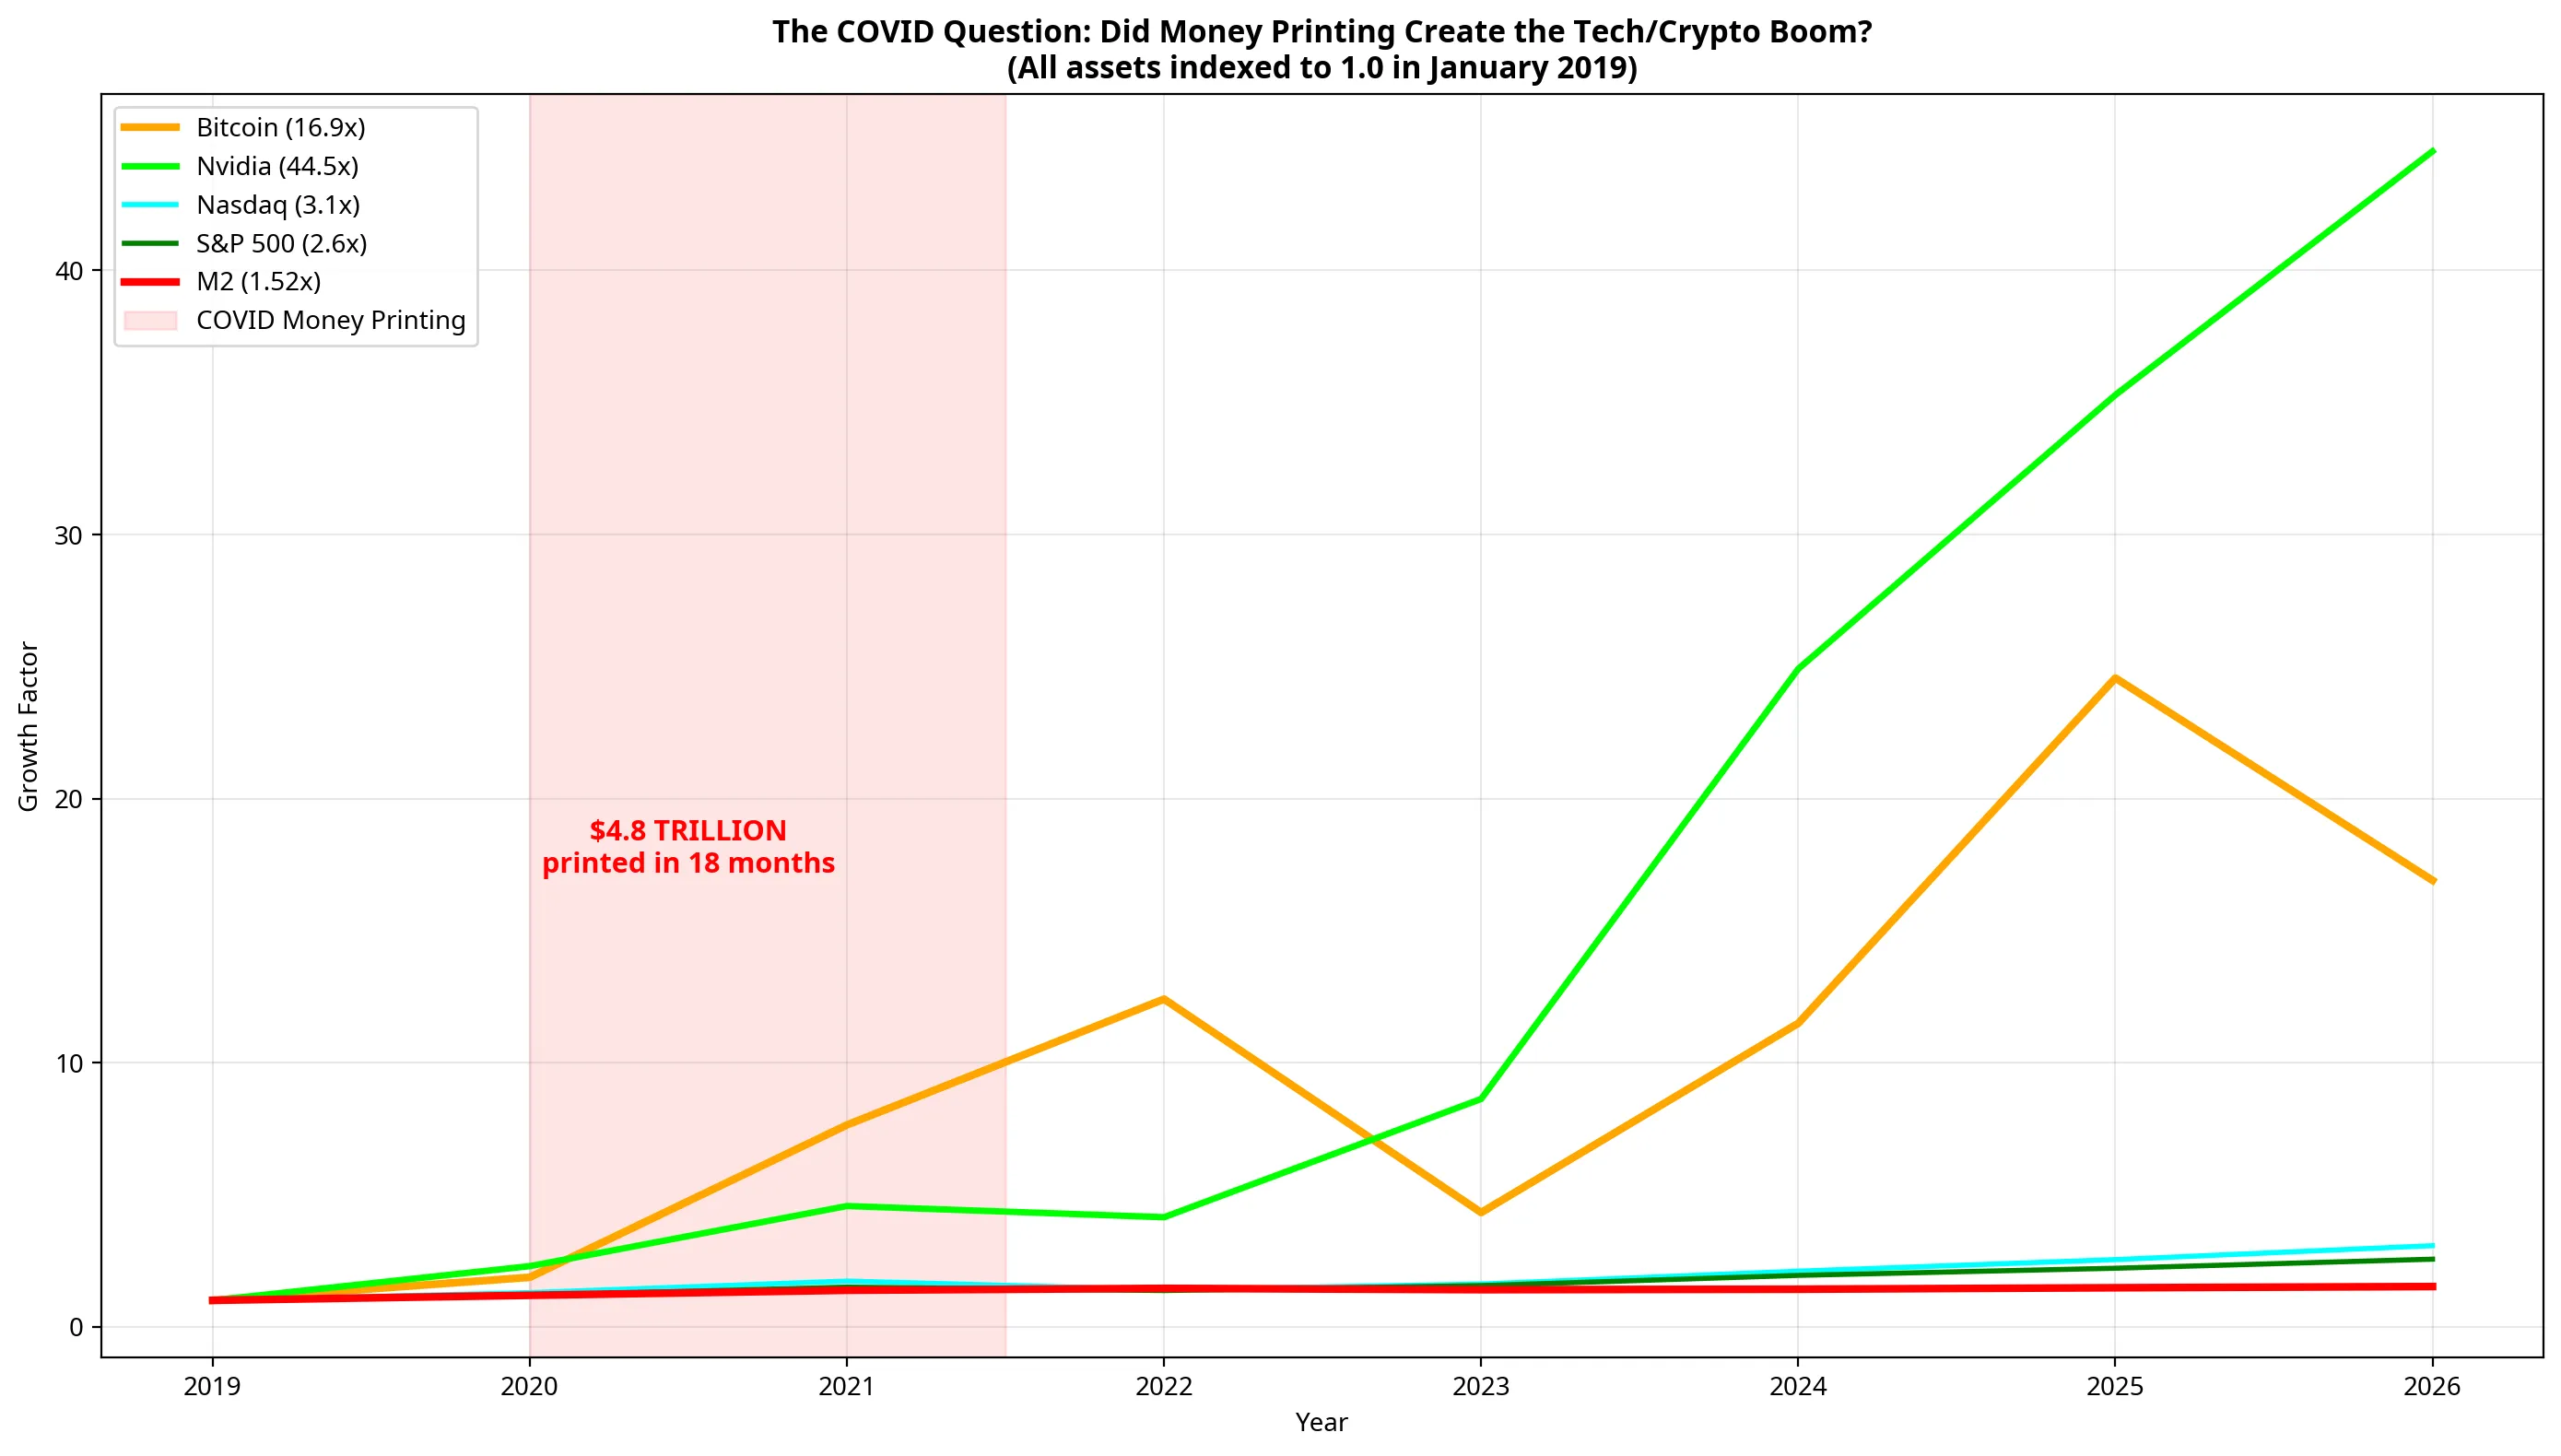
The chart above indexes all major assets to 1.0 in January 2019. Whilst the M2 supply grew by 1.52x over the subsequent years, lifting the S&P 500 (2.6x) and Nasdaq (3.1x) with it, Nvidia (44.5x) and Bitcoin (16.9x) violently decoupled from the money supply.
The conclusion: COVID money printing provided a massive liquidity tailwind that inflated all assets, but it cannot mathematically account for the exponential outperformance of AI and Crypto. Those gains represent genuine technological and monetary paradigm shifts.
The Modern Investor’s Decision
For an investor today under the age of 50, the 100-year charts are academically interesting but practically irrelevant. The decision matrix is based on the last 10 to 20 years.
If we look at the M2-adjusted returns (real purchasing power gained after accounting for money printing) across multiple recent timeframes, the hierarchy is absolute:
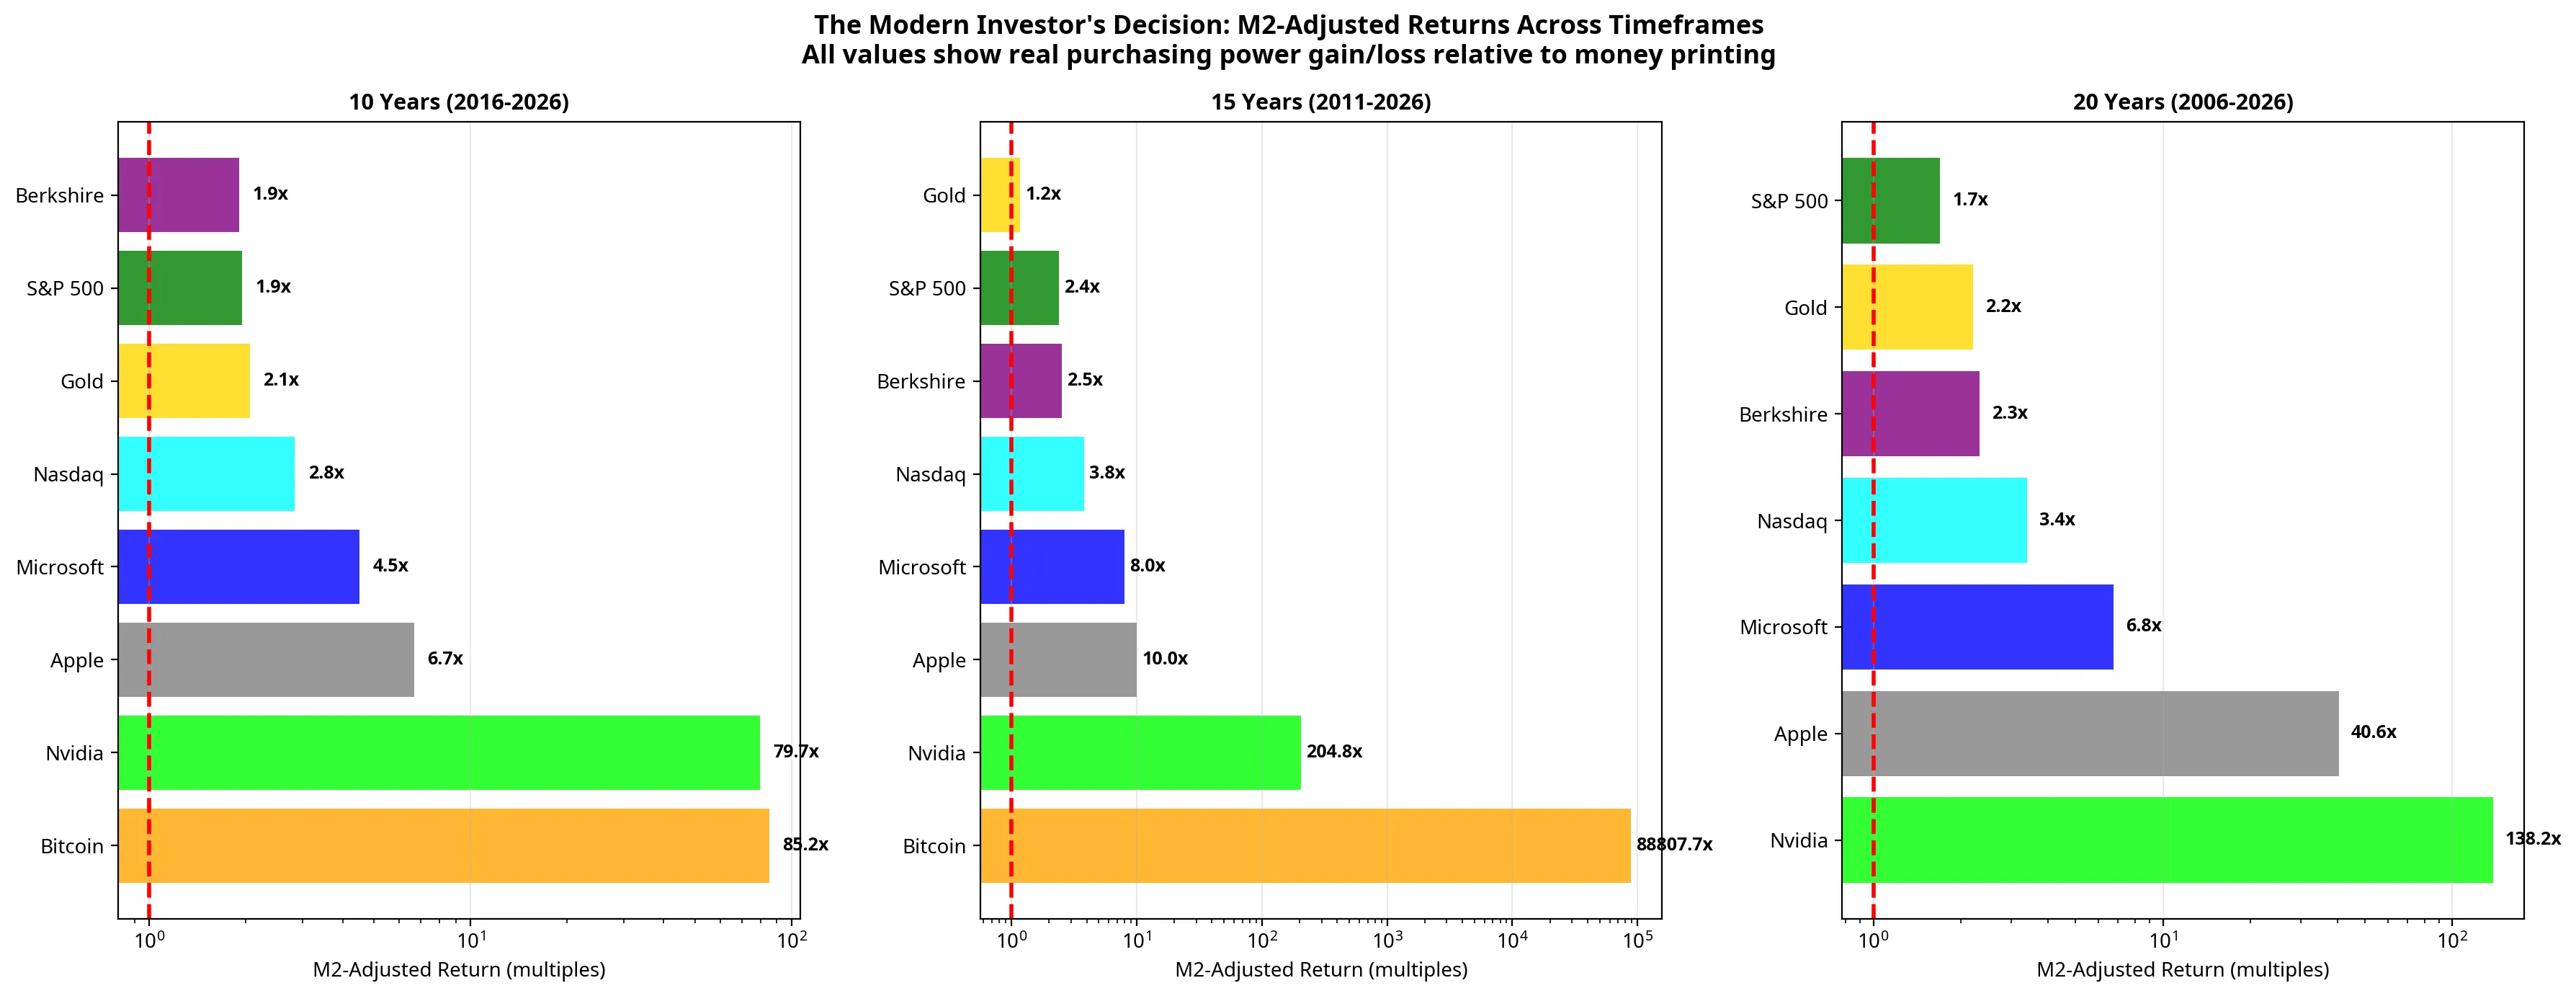
Over the last 10 Years (2016-2026):
- Traditional safe havens (Gold, S&P 500, Berkshire) barely doubled purchasing power (1.9x to 2.1x).
- Mega-cap tech (Apple, Microsoft) provided strong real returns (4.5x to 6.7x).
- The new paradigm assets (Nvidia, Bitcoin) provided exponential real returns (~80x).
Over the last 20 Years (2006-2026):
- The S&P 500 and Gold provided less than a 2.5x real return over two decades.
- Apple (40.6x) and Nvidia (138.2x) were the undisputed champions of the era.
The Final Verdict
For nearly a century, the only proven escape velocity from the printing press was the slow, methodical compounding of dividend-paying equities over a lifetime.
The digital age fundamentally altered this equation.
1. The Technology Premium: The zero-marginal-cost nature of software (Microsoft) and the global scale of the internet (Amazon, Apple) allowed companies to achieve in 30 years what industrial conglomerates took 60 years to build.
2. The Ultimate Monetary Hedge: Bitcoin’s performance since 2010 represents the highest M2-adjusted return of any liquid asset in recorded financial history. Whilst traditional assets like Gold and Real Estate failed to reliably clear the 6.56% monetary hurdle, Bitcoin’s programmatic scarcity functioned exactly as designed. It absorbed the excess fiat liquidity of the modern era more efficiently than any other vehicle.
The illusion of wealth is the belief that the dollars in your bank account or the nominal price of your house represent true value. The reality, proven across 100 years of data, is that fiat currency is a melting ice cube.
In the 20th century, you bought businesses to outrun the melting. In the 21st century, you buy the digital infrastructure and the digital scarcity that the printing press cannot replicate.
References
[1] Macrotrends LLC. “Historical Gold Prices - 100 Year Chart.” [2] Yahoo Finance. “Historical Price Data (AAPL, MSFT, AMZN, NVDA, ^IXIC).” [3] Federal Reserve Economic Data (FRED). “M2 Money Supply (M2SL), Monthly.” Federal Reserve Bank of St. Louis. [4] In2013Dollars. “Bitcoin Price History and Historical Data (2009-2025).” Official Data Foundation.