The Illusion of Wealth
The Illusion of Wealth & How to Beat Inflation: A 100-Year Perspective
This is the Series Overview of the "Illusion of Wealth" series tracking 100 years of dollar value dilution.
Table of Contents
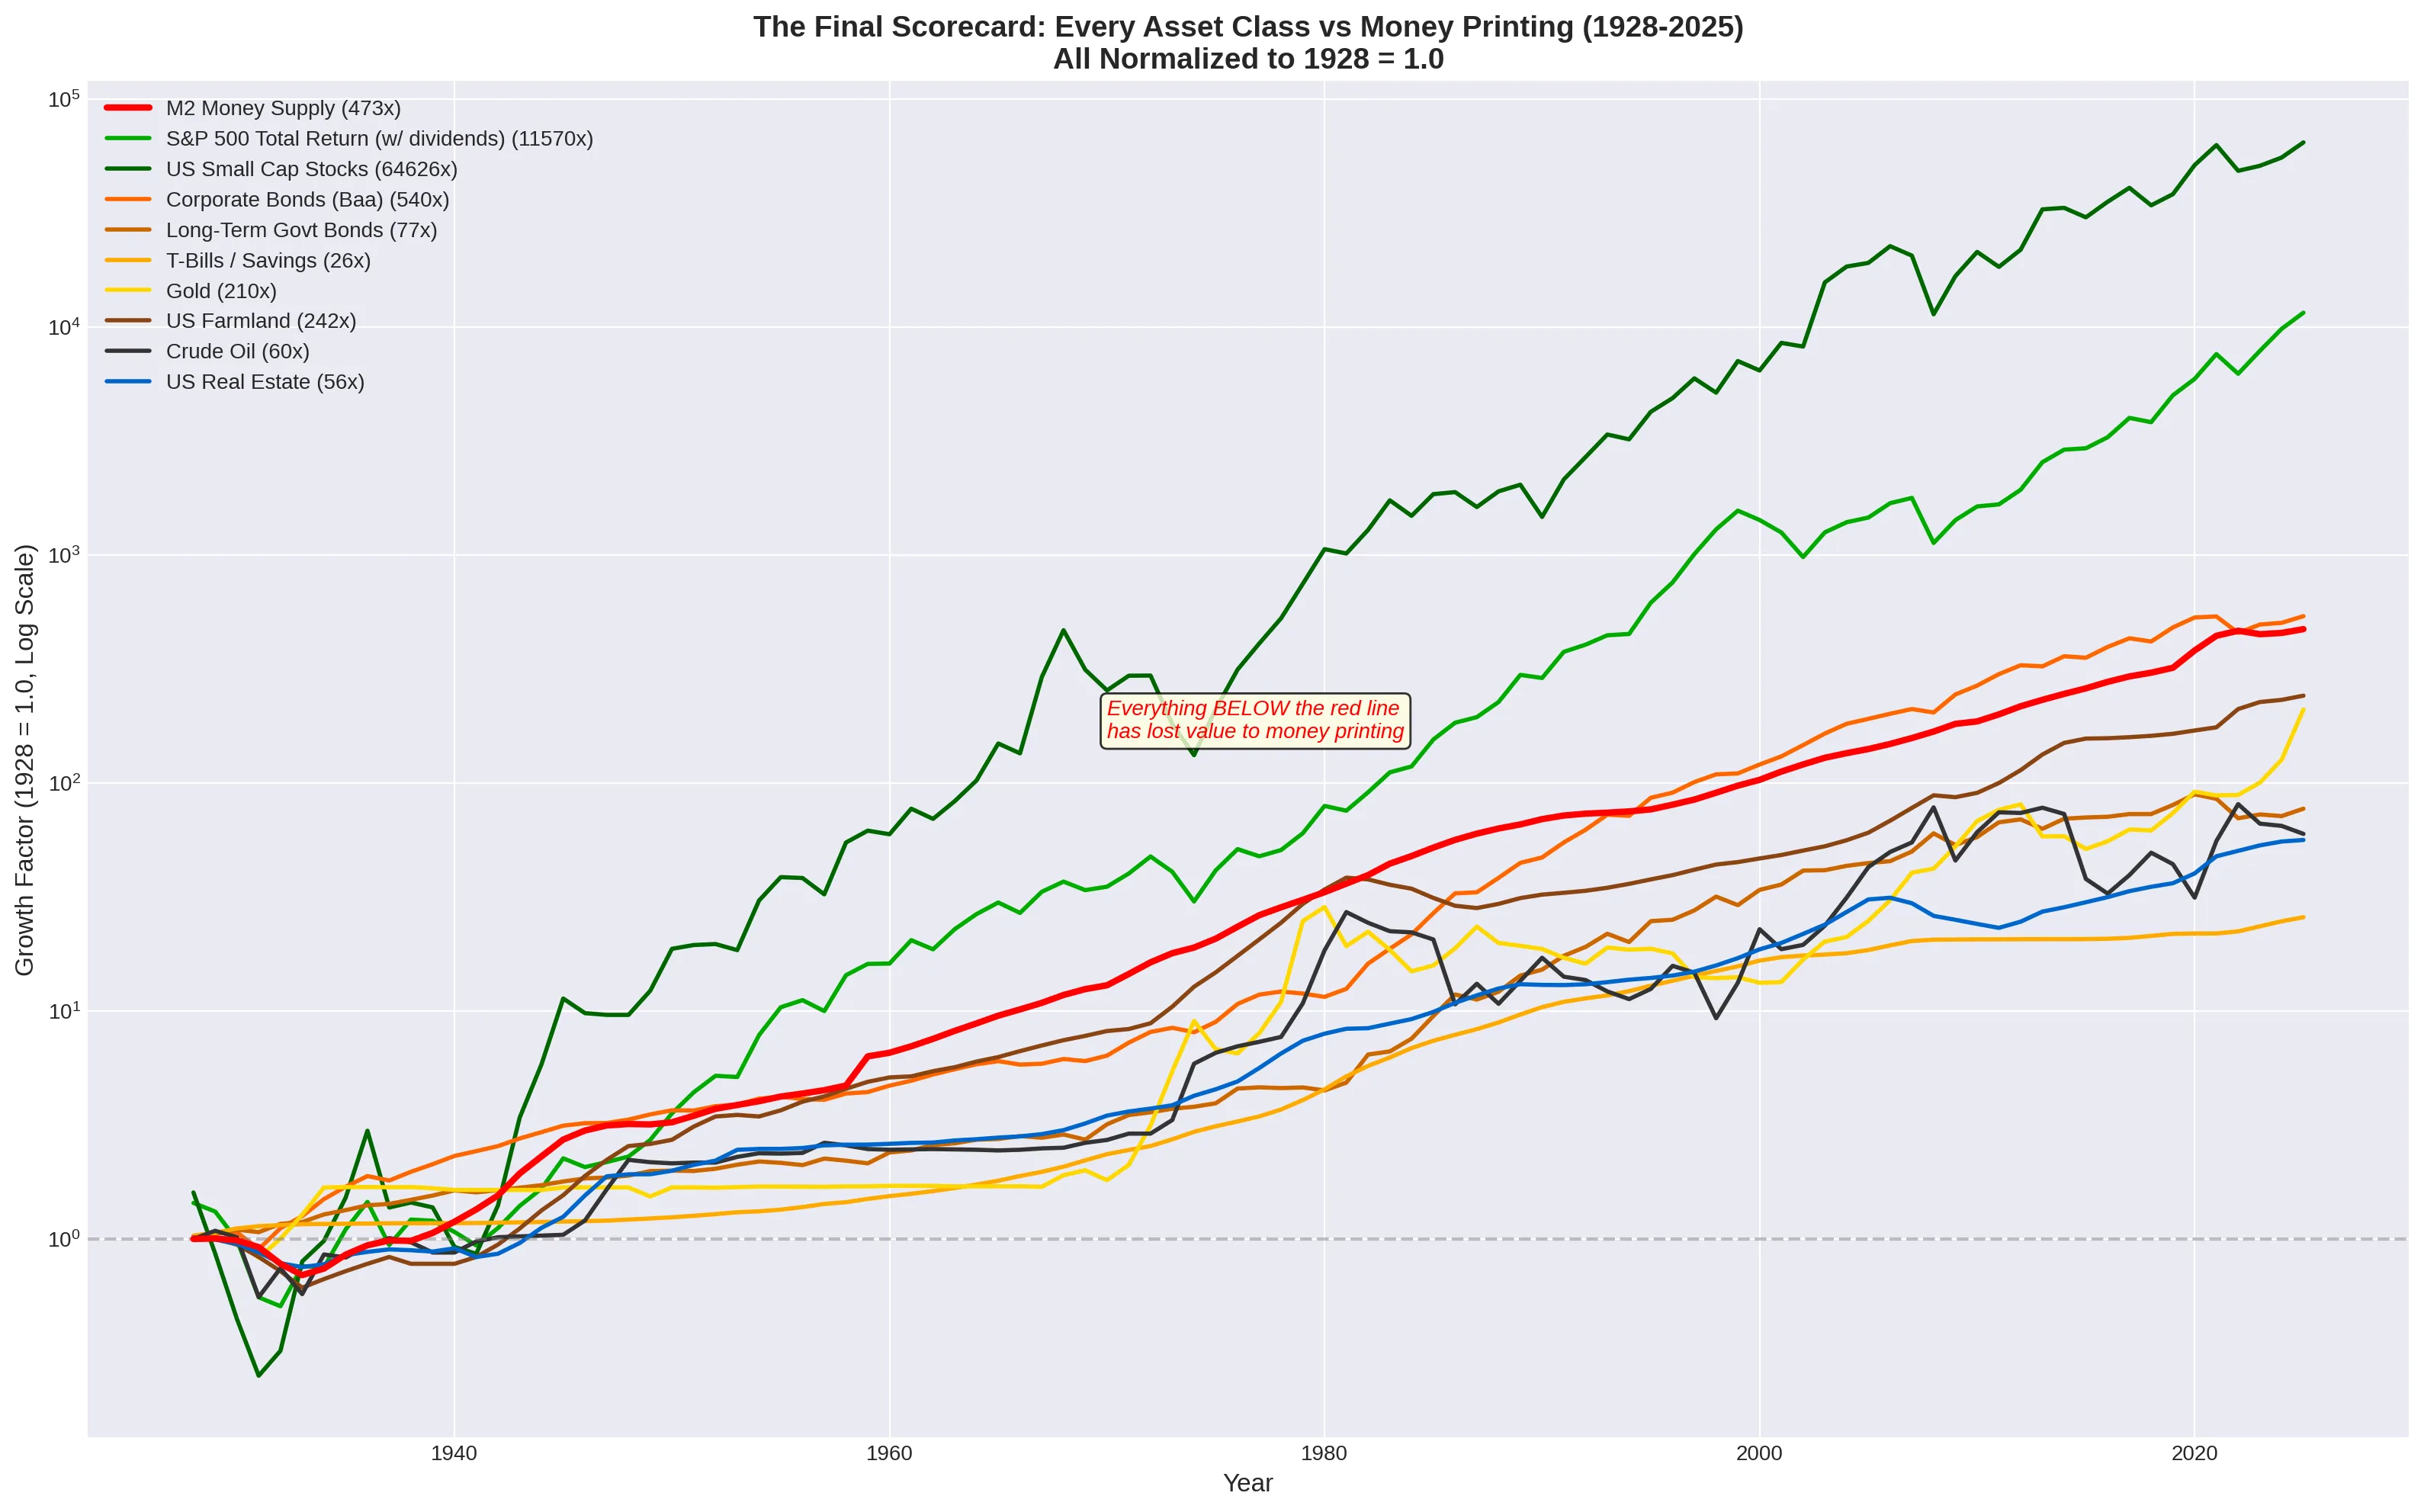
Over the past century, the US M2 money supply expanded from $43.7 billion to $22.8 trillion, a 522-fold increase. Every dollar printed dilutes every dollar already in existence. A dollar from 1926 now represents less than one-fifth of a cent of the total monetary pool. This isn’t CPI inflation. It is the raw dilution of the currency itself. Which raises the central question of this entire series:
Has anything actually grown in value, or has everything just been carried upward by the flood of new money?
To answer it, we tested 30 hypotheses across 100 years of data.
The Traditional Safe Havens
The first place most people look for protection is gold. Has gold preserved wealth against money printing? No. Gold grew 168x while M2 grew 503x, a 67% loss of purchasing power relative to the monetary pool. Silver fared worse, losing 87%. The metals that humanity has trusted for millennia simply cannot keep pace with a printing press that runs 24 hours a day.
Have house prices genuinely increased over 100 years? Again, no. US house prices grew 83x nominally but lost 83% against M2. UK housing performed better at 439x but still fell short. The universal belief that “property always goes up” is largely an illusion created by the currency collapsing beneath it.
Does the stock market beat money printing? Only if you reinvest every dividend. The S&P 500 by price alone (468x) slightly lost to M2 (503x). But with dividends reinvested, total return surged to 11,570x, crushing monetary dilution by 24x. The Dow Jones, without reinvestment, lost 42%. The mechanism is identical in both cases; only the rate of compounding differs.
The Savings Trap
Perhaps the most devastating finding concerns the strategy most people are taught from childhood. Do savings accounts grow wealth if you compound the interest and never spend it? No. At 3.4% average annual return versus 6.56% average annual money printing, savers lost 95% of their purchasing power over 100 years, even with interest fully reinvested.
Is the savings rate being set below money printing deliberate? The data shows that in every single decade of the last century, the savings rate sat below M2 growth. If it didn’t, government debt would become unserviceable. This appears structural, not coincidental.
The 6.56% Rule
This brings us to the single most important number in the entire series. Is there a threshold that determines whether an investment wins or loses? Yes: 6.56% per year, the average annual M2 growth rate. Any asset compounding above this preserves and grows wealth. Anything below it guarantees loss. No exceptions across 100 years of data.
Is compounding the secret to beating money printing? It is necessary but not sufficient. You must compound at a rate above 6.56%. Compounding a losing rate (like 3.4% savings) just means you lose slightly less badly. Are there other assets that beat M2 if you reinvest their yield? Yes. Real estate with rent reinvested (~9.3% CAGR), farmland with crop income (~9.3%), and corporate bonds with coupons (6.4%, barely) all crossed the threshold. The pattern is clear: any yield-bearing asset wins if total return exceeds 6.56% and you never withdraw.
The Buffett Mechanism
What about the Buffett approach: is that just compounding? Yes, but at 19.8% per year for 60 years with zero withdrawal. Berkshire Hathaway never paid a dividend. Every penny was reinvested. The result: a 1,027x M2-adjusted gain. The “secret” is the same mechanism available to anyone, just executed at a higher rate with absolute discipline.
Could a normal person have picked the winning stocks instead? Extremely unlikely. Only about 10% of all IPOs ever beat M2. For every Walmart, hundreds of retailers went to zero. Berkshire’s true advantage was that it required zero stock-picking skill from the investor. You bought one ticker and got Buffett’s genius for free.
Bubbles, Crashes, and the Illusion of Crisis
Are stock market bubbles real? Largely no, when measured against M2. The dot-com “bubble” was simply the S&P 500 briefly catching up to the money-printing line. The “crash” was it falling back below. Most “recoveries” since 2009 are just markets absorbing new QE money, not genuine growth. Are recessions genuine economic events or side effects of monetary policy? Every major recession coincides with a deceleration in M2 growth, and every recovery with its acceleration. The correlation across 100 years is striking.
The Digital Revolution
Has technology fundamentally changed the investing environment? Yes. Bitcoin achieved in 16 years (275,713x M2-adjusted) what Berkshire took 60 years to accomplish (1,027x). The digital age compressed the compounding timeline by roughly 4x.
Is the Nasdaq now a better bet than Berkshire? Over the last 20 years, yes. It benefits from structural exposure to exponential-growth companies. Berkshire’s edge was one man’s genius, and Warren Buffett is now 94. The Nasdaq is the new default compounder.
Is AI the biggest bubble of all time? No, by the fundamentals. Nvidia trades at P/E 32 with 63% margins and $326 billion revenue growing at 65% annually. Cisco at the dot-com peak had P/E 200 with $18 billion revenue. These are categorically different situations. Was the COVID money printing the real driver of tech and crypto gains? Partially, but M2 grew 1.5x from 2019–2021 while Nvidia grew 44.5x and Bitcoin 16.9x. The outperformance is too extreme to be purely monetary; genuine adoption is the dominant factor.
The Bitcoin Question
Is Bitcoin the best monetary hedge in recorded history? By the data, yes. No other asset has achieved a higher M2-adjusted return over its existence. The structural reason: provably fixed supply (21 million) against perpetually expanding fiat.
Why would Bitcoin outperform gold if both are considered scarce? Verifiable scarcity versus estimated scarcity. Bitcoin’s supply is mathematically proven and auditable. Gold’s total supply is unknown, with ~1.7% added annually. After the 2024 halving, Bitcoin’s stock-to-flow (120) is nearly double gold’s (62).
Does holding Bitcoin for 5+ years guarantee beating money printing? In 11 of 12 historical five-year windows since 2010, yes. Not guaranteed, but statistically dominant. Is Bitcoin’s declining CAGR a sign it will eventually fail to beat M2? Mathematically unlikely long-term. The declining percentage reflects a larger base, but fixed supply against expanding M2 creates a rising structural floor with each halving cycle.
Why does gold appear to beat M2 over the last 5 years when it lost over 100 years? Anomalous recent performance driven by central bank de-dollarisation. Gold’s 5-year CAGR of 20% is 4x its 100-year average of 5.6%. Unlike Bitcoin (structurally fixed supply) or tech (structurally growing earnings), gold has no fundamental reason to sustain this pace.
The Verdict
For a modern investor under 50, what actually works? The data points to a clear hierarchy: Nasdaq (safest broad tech exposure, beats M2 reliably), Bitcoin (highest asymmetric upside, requires 5+ year discipline), Nvidia/AI infrastructure (high-conviction bet backed by real earnings). Berkshire and gold serve as conservative foundations but offer marginal M2-adjusted returns at best.
The minimum requirement for financial survival is not safety. It is growth above 6.56% per year, compounded, never withdrawn. For 100 years, conservative investing was the riskiest strategy of all.